Double Trouble: Exposing the Risks of Hurricanes Helene and Milton
In the span of two weeks in late September and early October, hurricanes Helene and Milton hit the southeastern U.S., with the impact of each storm likely to eclipse USD 50 billion in direct losses.1 The damage caused largely resulted from the physical hazards that the assets in the track of each storm are most exposed to. For investors, knowing where a portfolio company's assets are physically located is therefore key to understanding the potential incurred costs from high-impact events.
Hazards that present the greatest risk to locations can vary considerably geographically. We find that, of asset locations in the southeastern U.S. in the MSCI GeoSpatial Asset Intelligence database, 7.2% and 3.6% have the highest exposure among all hazards to pluvial and coastal flooding, respectively, as detailed in the map.2 Many locations with high pluvial-flood risk are in Appalachia, an area impacted by inland flooding from Helene, while over a third of locations with high coastal-flood risk are along the west coast of Florida, an area that experienced coastal flooding during Milton. While Florida has been particularly vulnerable to the impacts of tropical cyclones in the past, areas such as Asheville, North Carolina have been described as a "climate haven."3 However, while climate havens may have a relatively small risk of extreme-weather events, it is never zero.
Floods are one of the costliest natural hazards today and the cost is projected to grow as more intense events become more common. As the frequency of pluvial-flood events is expected to increase, the cost of damage from a 200-year event today will be similar to that of a 100-year event in 2100, as the bar chart depicts. Manufacturing, industrial and warehouse assets have the highest costs related to asset damage from pluvial floods, highlighting the additional expected costs from business interruption and downstream supply-chain disruptions.
Assets in southeastern U.S. with the greatest exposure to pluvial and coastal flooding
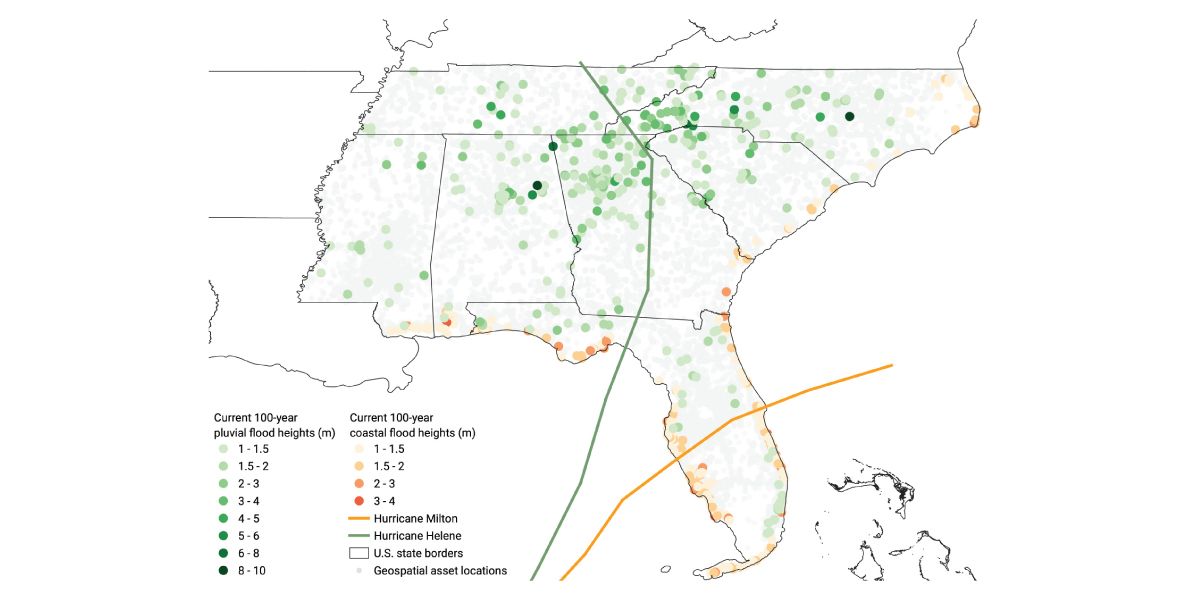
Data as of Oct. 28, 2024. Locations with pluvial flooding (green points) and coastal flooding (orange points) as the hazard with most exposure to, defined as the greatest hazard percentile score across all hazards with at least 100-year flood height of 1 meter under current conditions. Tracks for hurricanes Helene (green) and Milton (orange) are provided by the National Hurricane Center. Analysis covers all assets in the southeastern U.S. in the MSCI GeoSpatial Asset Intelligence database (gray points). Source: MSCI ESG Research
Assets with the highest costs related to asset damage from pluvial floods
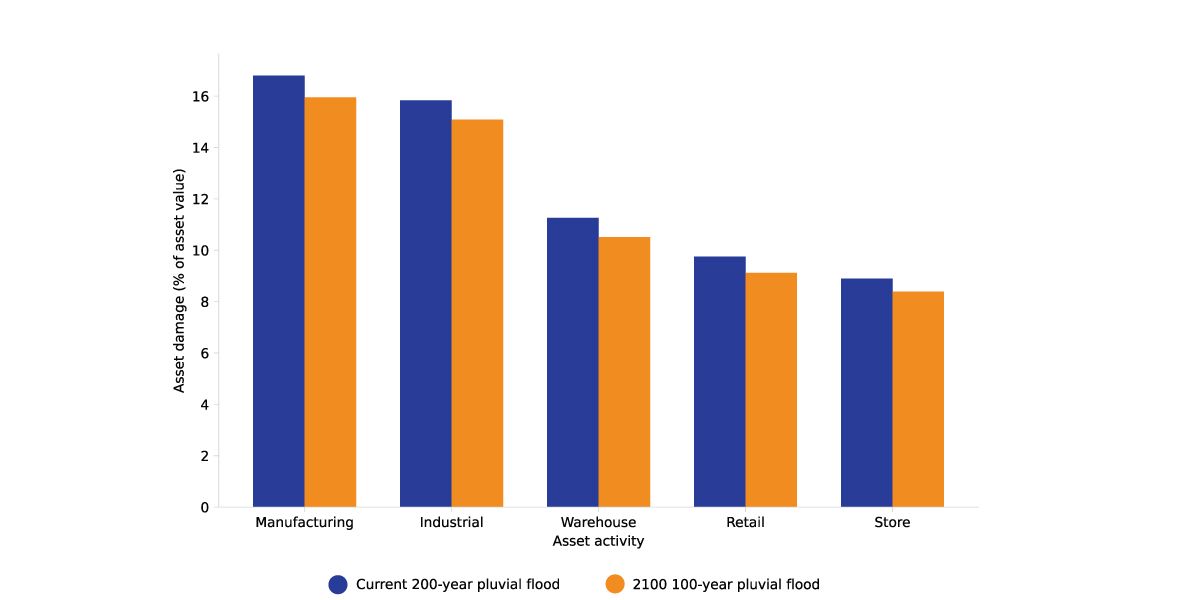
Data as of Oct. 28, 2024. Top five asset activities with pluvial flooding as the hazard with most exposure to, defined as the greatest hazard percentile score across all hazards. Asset-damage costs are associated with pluvial flooding for a 200-year event today versus that of a 100-year event in 2100 under assumptions of the Network for Greening the Financial System (NGFS) REMIND 3°C Current Policies scenario. Costs are averaged across asset activity. Analysis covers all assets in the southeastern U.S. in the MSCI GeoSpatial Asset Intelligence database. Source: MSCI ESG Research

Subscribe todayto have insights delivered to your inbox.
Navigating the Financial Risks of Flooding
Assessing the widespread exposure and varying characteristics of coastal, fluvial and pluvial flooding is imperative for financial institutions to understand and manage the potential financial impacts of different flood types.
Location, Location, Location: The Role of Elevation in Flood Models
To understand the financial risks from flooding, knowing an asset’s location is important, but so too is its elevation. Using the MSCI GeoSpatial Asset Intelligence dataset we explore the impact of getting it wrong.
MSCI GeoSpatial Asset Intelligence
The transition to a low-carbon economy is taking longer than expected, while physical risks from climate change are accelerating.
1 “Helene, Milton losses expected to surpass “truly historic” $50 billion each.” CBS News, Oct. 17, 2024.2 As of October 2024, the MSCI GeoSpatial Asset Intelligence database contains physical hazard data for 912,142 individual, globally distributed company assets belonging to 61,906 public and private companies. For this analysis, the southeastern U.S. refers to asset locations in the states of Florida, Georgia, South Carolina, North Carolina, Tennessee, Alabama and Mississippi and includes 86,975 locations belonging to 1,082 companies. All hazards refer to those hazards covered in MSCI GeoSpatial Asset Intelligence.3 “‘Climate Havens’ Don’t Exist.” The New York Times, Oct. 1, 2024.
The content of this page is for informational purposes only and is intended for institutional professionals with the analytical resources and tools necessary to interpret any performance information. Nothing herein is intended to recommend any product, tool or service. For all references to laws, rules or regulations, please note that the information is provided “as is” and does not constitute legal advice or any binding interpretation. Any approach to comply with regulatory or policy initiatives should be discussed with your own legal counsel and/or the relevant competent authority, as needed.