Murky Waters: Climate Signals and Uncertainty in Flood Risk
The common approach of using statistics based on measurements from past flood events to estimate the likelihood of future flooding is becoming increasingly outdated. Due to intensified rainfall and rising sea levels, the more than 1 degrees C of global warming already seen has changed the processes that govern flood generation. It has become essential, therefore, for financial institutions to use forward-looking climate-scenario analysis to accurately estimate their current and future flood risk.
Even if the global mean temperature was kept at its current level, the risk of coastal flooding would increase for decades or centuries as polar ice and glaciers melt slowly in response to the global warming already present in the climate system.1 This "lagged" climate-change signal for coastal flooding is why we see little relative difference between climate-change scenarios for coastal flooding compared to other flood types (left-hand exhibit), and why a risk assessment for coastal floods would require forward-looking climate data even if global warming were to end today.
Fluvial flooding does not show this lagged climate signal but is a complex topic in its own right. Hazard and cost trends related to fluvial floods are less certain and vary more by region than for other flood types because fluvial floods are generated through the interplay of many processes, which all face regionally differing impacts from climate change. This means that in some regions fluvial-flood risk is expected to increase in the future, while other regions will see no changes or even reduced damages (right-hand exhibit).
This analysis highlights the importance of climate-scenario analysis for flood-risk assessments. It shows how climate change affects each flood type differently, with unexpected changes in financial risk, and that financial institutions will need to leverage all tools and data at their disposal to navigate this complex landscape.
Average flood-related MSCI Climate Value-at-Risk for different warming scenarios
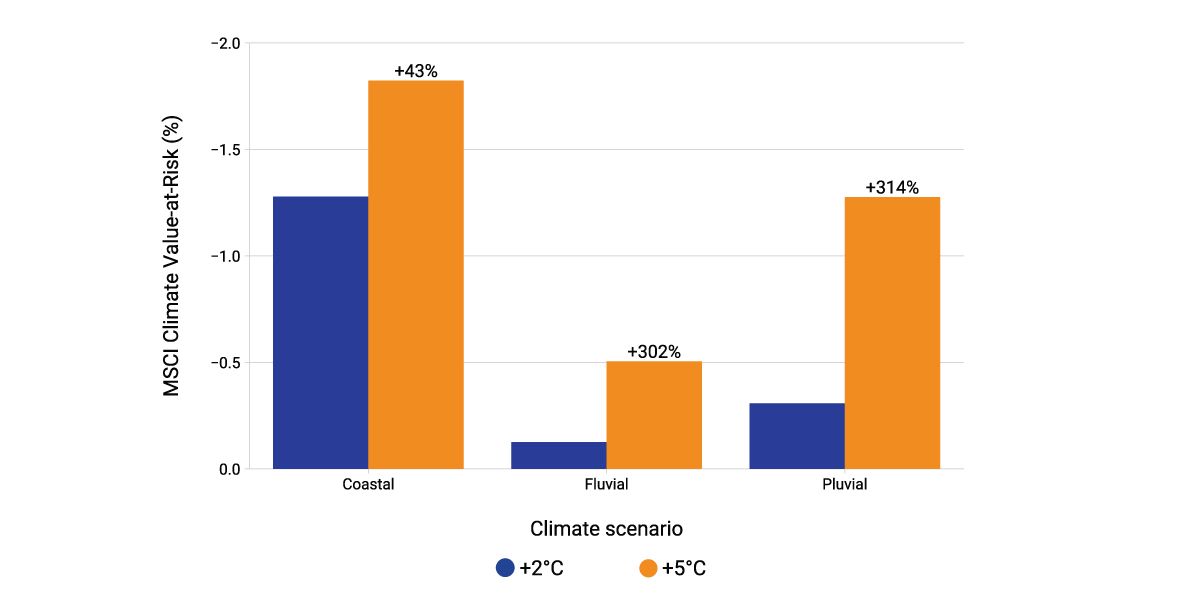
Data as of Aug. 20, 2024. Analysis covers constituents of the MSCI ACWI Investable Market Index. Temperature increases refer to global mean temperature relative to an 1850-1900 reference period, where +2°C is based on the NGFS REMIND Orderly scenarios and +5°C is based on the IPCC SSP5-8.5 scenario. The numbers on top of the orange bars represent the relative difference between the two scenarios. MSCI Climate Value-at-Risk is the expected net present value of all additional costs incurred from the respective flood type from 2023 until 2100, relative to the exposure-growth-adjusted company value. Source: MSCI ESG Research
Trends in annual average flood damages for different flood types
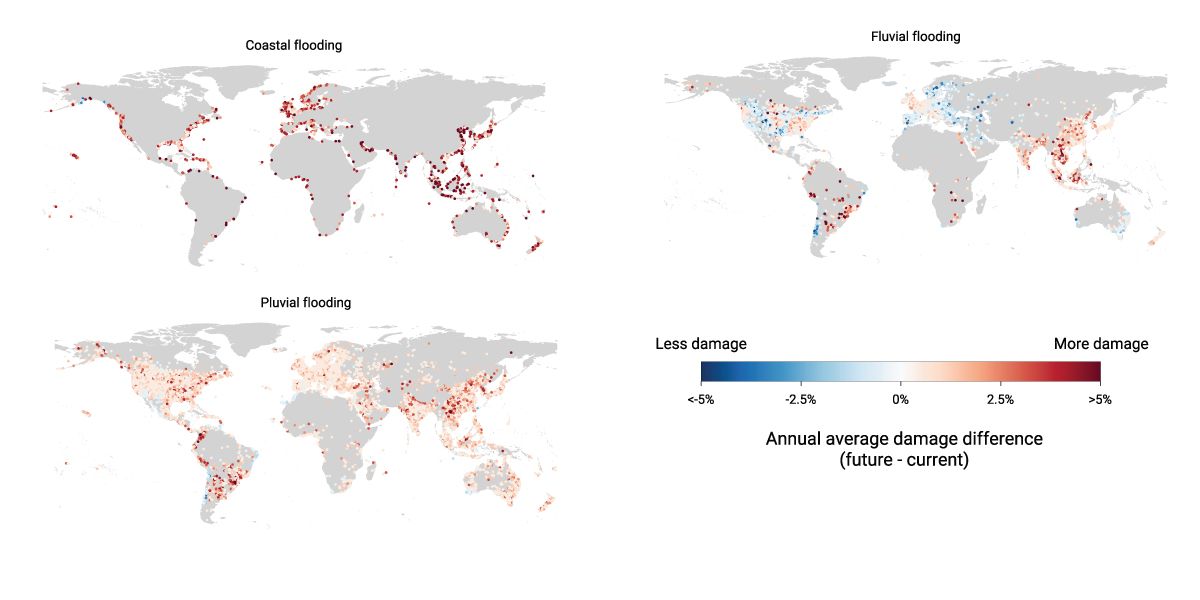
Data as of Aug. 20, 2024. Showing differences in annual average asset damages (in percent of current asset value) for assets in the MSCI GeoSpatial Asset Intelligence database. Differences are calculated between the year 2100 for the high-warming IPCC SPP5-8.5 scenario and the year 2023. Only locations with a difference not equal to zero are shown, which are 56,012 for coastal flooding, 64,102 for fluvial flooding and 320,517 for pluvial flooding. Source: MSCI ESG Research

Subscribe todayto have insights delivered to your inbox.
Navigating the Financial Risks of Flooding
Assessing the widespread exposure and varying characteristics of coastal, fluvial and pluvial flooding is imperative for financial institutions to understand and manage the potential financial impacts of different flood types.
Location, Location, Location: The Role of Elevation in Flood Models
To understand the financial risks from flooding, knowing an asset’s location is important, but so too is its elevation. Using the MSCI GeoSpatial Asset Intelligence dataset we explore the impact of getting it wrong.
Asset Risks in a Time of Flood
Flooding is one the costliest of all natural hazards and climate change is raising the stakes. In this episode, we discuss the need for precise asset locations and forward-looking climate models to figure out your risk exposure.
1 “Global flooding to increase 9%-49% this century, new study reveals,” Fathom, Aug. 21, 2024.
The content of this page is for informational purposes only and is intended for institutional professionals with the analytical resources and tools necessary to interpret any performance information. Nothing herein is intended to recommend any product, tool or service. For all references to laws, rules or regulations, please note that the information is provided “as is” and does not constitute legal advice or any binding interpretation. Any approach to comply with regulatory or policy initiatives should be discussed with your own legal counsel and/or the relevant competent authority, as needed.