
Private Capital in Focus: VC Returns Pulled Away Further in Q2
Mentioned in this quick take:
Private-equity returns rebounded in the second quarter of 2026, led by another strong showing from venture capital that widened the dispersion in returns across asset classes.
The MSCI Global Private Equity Closed-End Fund Index returned 5.6%, up from 0.6% in the first quarter, as all three major private-equity strategies posted positive returns. Venture capital stood out with a 12.7% quarterly return, accelerating from 4.5% in Q1. Rising valuations among a handful of large, AI-linked companies were a major driver of Q2 returns, pushing the asset class further ahead of buyout. Buyout returned 2.5%, reversing its 1.1% decline at the start of the year.
The rebound in private equity came alongside an even stronger rally in listed equities, with the MSCI ACWI IMITM Index returning 15.1% in Q2. The strength in both public equities and venture capital has been driven by an increasingly concentrated group of companies. At the end of June, the 10 largest constituents of the MSCI ACWI IMI accounted for about 26% of index weight. Venture capital has moved toward a similar level: the 10 largest holdings in the MSCI Global Venture Capital Closed-End Fund Index represented 22% of index value at the end of Q2.
Private credit continued to deliver steadier returns. The MSCI Global Private Credit Closed-End Fund Index gained 1.7%, up from 0.9% in Q1. Opportunistic lending led the group with a 2.4% return, compared with 1.0% for both direct lending and real-estate debt.
Private real assets returned 1.8% in Q2, little changed from the first quarter. Natural resources led with a 3.6% gain, followed by infrastructure at 2.5%. Private real estate remained subdued, returning just 0.2%.
The results highlight that the variation in returns across and within private-capital strategies remains a key story for investors in 2026.
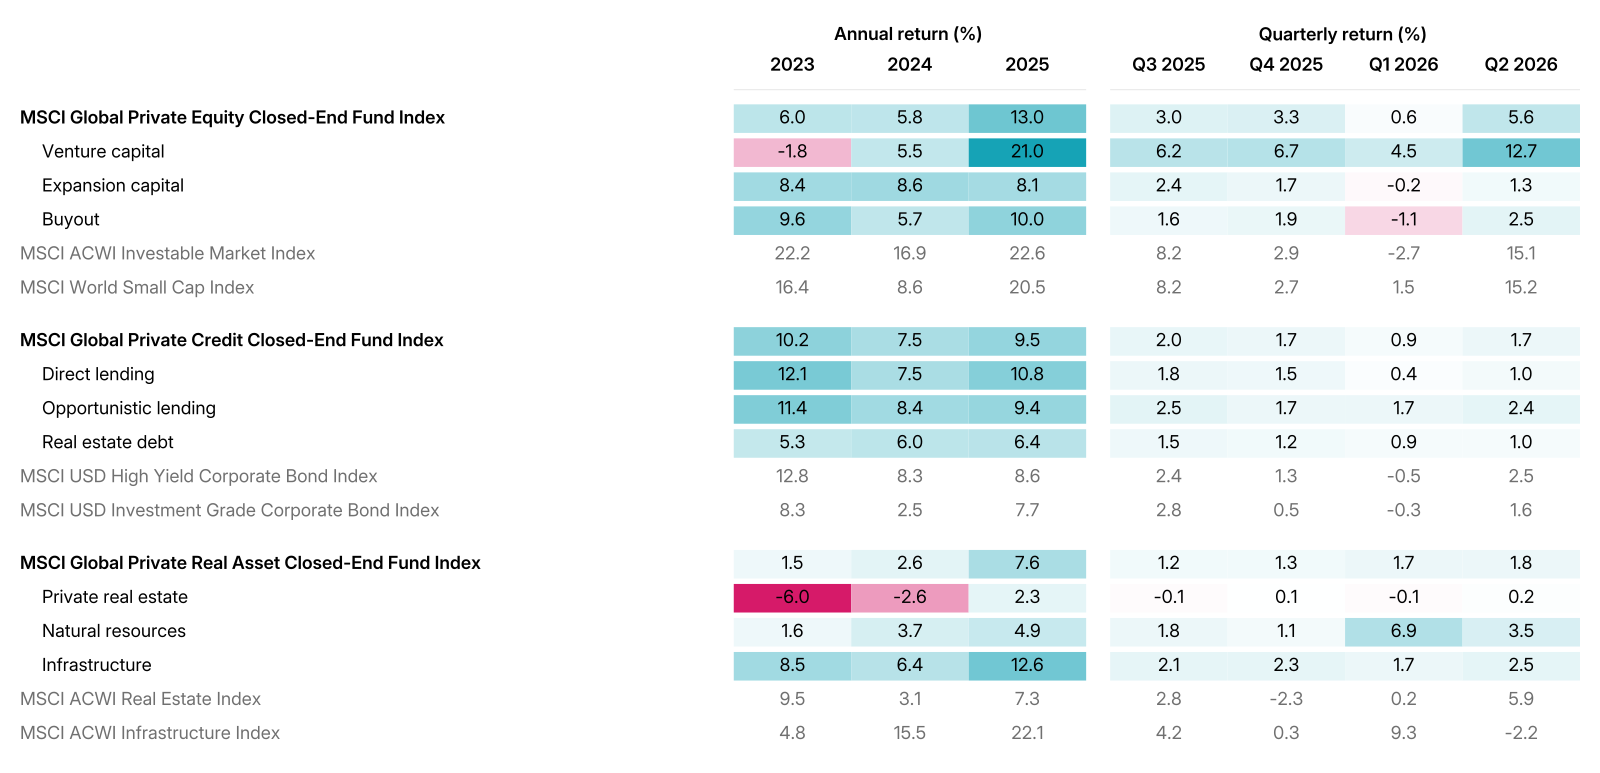
Quarterly returns are calculated in USD using the Modified Dietz method and are not annualized. Calendar-year returns represent compounded quarterly returns. Data as of Q2 2026 from the MSCI Private Capital Universe.


Subscribe todayto have insights delivered to your inbox.
The Target Is Not the Benchmark
Private markets have scaled, but the standards used to judge them haven't. See why a CPI hurdle, a PME and a peer median all fall short of a real benchmark.
How Strategy Shaped Returns in Private Real Estate
Core real-estate funds are beating riskier strategies this year. But over 15 years the outperformance flips. See what the MSCI All Private Real Estate Fund Index can show about strategy and timing.
The content of this page is for informational purposes only and is intended for institutional professionals with the analytical resources and tools necessary to interpret any performance information. Nothing herein is intended to recommend any product, tool or service. For all references to laws, rules or regulations, please note that the information is provided “as is” and does not constitute legal advice or any binding interpretation. Any approach to comply with regulatory or policy initiatives should be discussed with your own legal counsel and/or the relevant competent authority, as needed.