
Scenario Analysis: When French Bond Spreads Widen
Mentioned in this quick take:
France’s 10-year government-bond spread to Germany is now wider than Italy’s and near levels last seen during the eurozone crisis. Political uncertainty around the country’s 2027 budget and election could lead to further repricing. Unlike in previous episodes of French stress, German yields have risen alongside French yields in 2026. We use MSCI’s predictive stress-testing framework to examine two scenarios: eurozone fragmentation and a fiscal-regime shift.
Contagion or a French repricing
In both scenarios, French fiscal consolidation stalls; they differ in how markets transmit the stress. In our scenario of eurozone fragmentation, budget uncertainty and ratings pressure push France’s spread above its 2011 peak, with stress spreading to Italy and other eurozone sovereigns. Investors seek safety in bunds, while European bank stocks and the euro fall. Tighter financial conditions and weaker growth lower long-term inflation expectations slightly, even as energy prices stay high.
In our scenario of a fiscal-regime shift, markets anticipate looser French fiscal policy after the 2027 election and demand more compensation for holding long-dated debt. The French yield curve steepens, while eurozone fiscal and inflation concerns lift German yields too. The euro weakens, and bunds provide no offset.
German yields shape eurozone bond losses
We applied these shocks to a hypothetical portfolio of global equities, bonds, private equity, private credit and real estate.1
In USD terms, the composite portfolio loses 5% under eurozone fragmentation, as European equities fall 15% and the euro weakens. Under a fiscal-regime shift, French 10-year yields rise further but German yields rise too, so the spread to Germany widens less, and the portfolio loses 3%. Eurozone government bonds in EUR terms lose 4% in the fiscal-regime shift, compared with 2% under fragmentation, because bunds fall alongside French bonds. For a euro-based investor, the euro’s fall lifts the unhedged dollar assets, so the portfolio gains 0.8% under the eurozone fragmentation and 0.3% under the fiscal-regime shift.
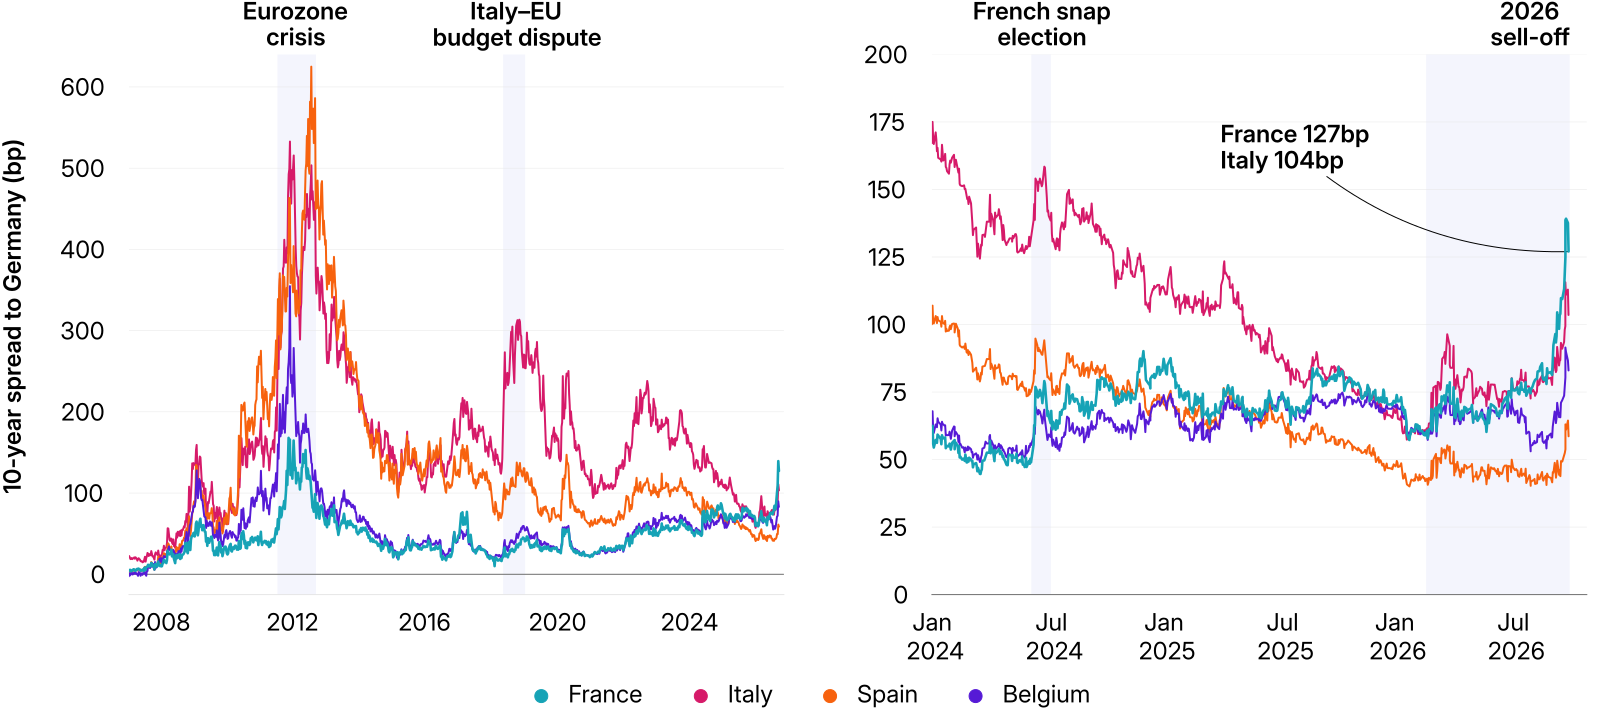
Spread of 10-year zero-coupon government yields over the German equivalent. Left: weekly, January 2006 to October 2026; right: daily, January 2024 to Oct. 6, 2026.
Portfolio impact of the scenarios based on market data as of Oct. 6, 2026. Source: S&P Global Market Intelligence, MSCI

Subscribe todayto have insights delivered to your inbox.
Multi-Asset Class Factor Model
An asset allocation model that informs systematic strategies with consistency across asset classes and enables you to identify key risk and return drivers.
Scenario Analysis: How Could Soaring US Debt Impact Markets?
Soaring U.S. government debt could trigger market losses from rising yields or inflation from a politicized Federal Reserve, or gains with fiscal discipline.
Scenario Analysis: Two Routes to Higher Treasury Yields
A rise in 10-year Treasury yields can hit portfolios in very different ways. A stronger dollar can cushion losses for non-USD investors; a weaker one can amplify them. See where losses land.
1 The results are generated by using model correlations to propagate shocks to the portfolios, using MSCI's BarraOne®. MSCI clients can download the correlated BarraOne stress test and RiskMetrics® RiskManager® stress test. Note that the above stress-test results capture the effect of repricing the assets, not the income component. Treasury inflation-protected securities (TIPS) are represented by the iBoxx TIPS Inflation-Linked Index provided by S&P Dow Jones Indices. U.S. Treasurys, equities and corporate bonds are represented by MSCI indexes. Private equity and private credit are represented by model portfolios. U.S. real estate is represented by the MSCI/PREA U.S. AFOE Quarterly Property Fund Index. The composite portfolio is 35% global public equities, 24% U.S. Treasurys, 2% TIPS, 12% U.S. investment-grade bonds, 2% U.S. high-yield bonds, 10% U.S. real estate and 15% global private assets (13% private equity, 2% private credit).
The content of this page is for informational purposes only and is intended for institutional professionals with the analytical resources and tools necessary to interpret any performance information. Nothing herein is intended to recommend any product, tool or service. For all references to laws, rules or regulations, please note that the information is provided “as is” and does not constitute legal advice or any binding interpretation. Any approach to comply with regulatory or policy initiatives should be discussed with your own legal counsel and/or the relevant competent authority, as needed.