Amid the turbulence in the Chinese equity market after the U.S. imposed new tariffs on Chinese imports earlier this month, one characteristic was a steadying force: the degree of Chinese state ownership.
The market's initial reaction to the tariff shock, measured by the performance of the MSCI China Index, was to drop 15% from April 3 to April 7, but by April 25, the index was up 11% from its April 7 low. Chinese companies with higher exposure to state ownership and/or lower exposure to U.S. revenue sources proved more resilient over these chaotic days.
SOE exposure helped tame the bear
From April 3 to April 25, the best-performing factor in the Chinese equity market, according to the MSCI China Local Equity Factor Model, was the state-owned enterprise (SOE) factor, a distinctive factor in the China market. Although heavily state-influenced companies may lag in bull markets, in times of stress they are likely to receive policy support and directives intended to shore up confidence.
Location, location, location — less US exposure, greater odds of resilience
Our analysis of the economic exposure of Chinese industries shows that those with high U.S. revenue exposure — such as pharmaceuticals and biotech, tech hardware and autos — suffered steep losses, while defensive industries that depended less on U.S.-source revenues — including food, beverage and tobacco, telecom and utilities — had smaller declines.
In addition to an industry's or company's revenue-exposure distribution and level of state policy support, the geographic location of its assets could be a useful indicator of potential tariff-related impacts.
Chinese industry performance tied to US revenue exposure
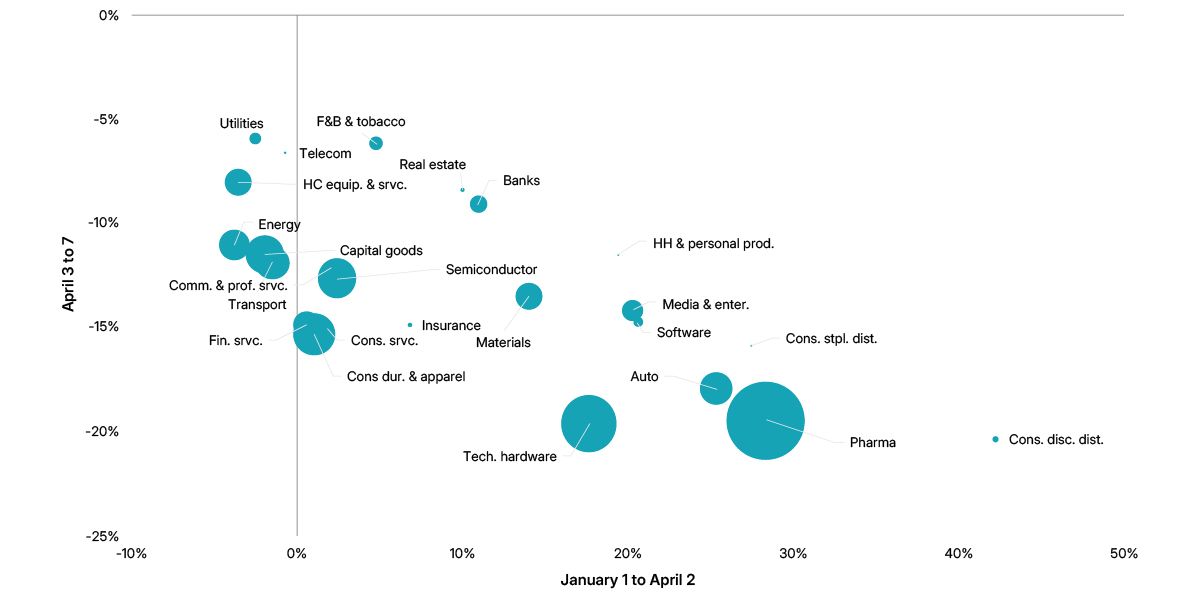
Bubble size is the weighted-average economic exposure to the U.S. of the MSCI China Index’s GICS® industry groups. GICS is the global industry classification standard jointly developed by MSCI and S&P Global Market Intelligence.
SOE factor was best performer in the China A-shares market from April 3 to 25
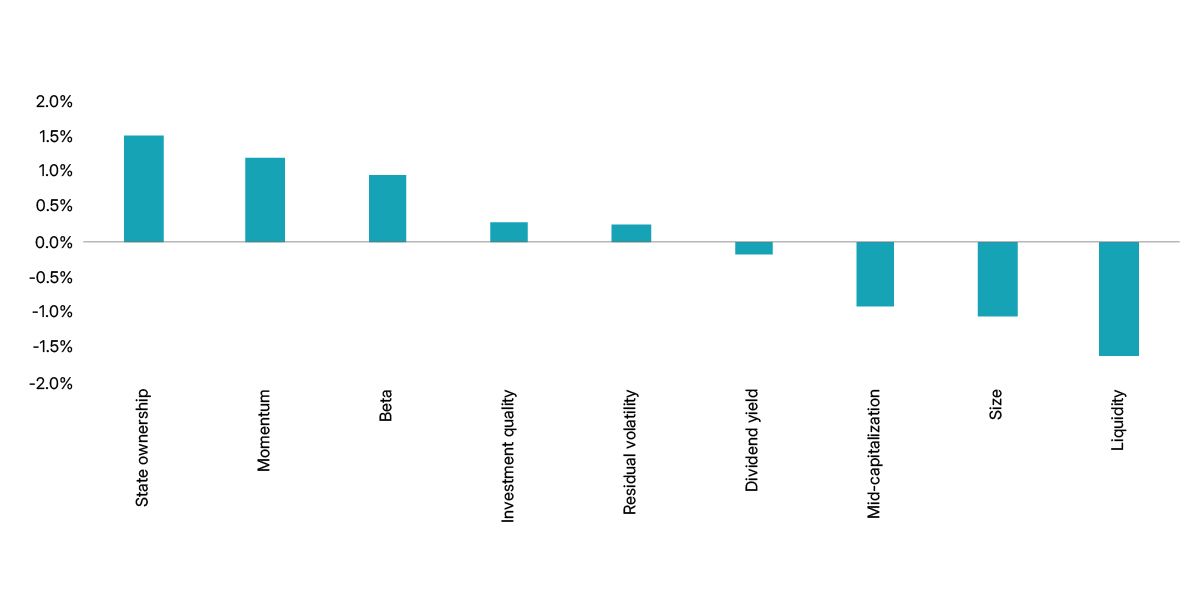
The chart includes the top- and bottom-performing factors in China A-shares based on the MSCI China Local Equity Factor Model.


Subscribe todayto have insights delivered to your inbox.
Mapped or Missed? Navigating Tariff Uncertainty
Traceable supply chains can offer clarity amid trade-policy volatility, aiding businesses in forecasting costs, navigating tariffs and reducing investor risk.
Tariffs Raise the Specter of Stagflation: Three Macro Scenarios
Economists have cut growth forecasts and raised inflation expectations since the U.S. tariff announcement on April 2. For multi-asset-class investors, the key question is how shifting macroeconomic expectations could affect asset prices.
The content of this page is for informational purposes only and is intended for institutional professionals with the analytical resources and tools necessary to interpret any performance information. Nothing herein is intended to recommend any product, tool or service. For all references to laws, rules or regulations, please note that the information is provided “as is” and does not constitute legal advice or any binding interpretation. Any approach to comply with regulatory or policy initiatives should be discussed with your own legal counsel and/or the relevant competent authority, as needed.