Borrowed Time? Downside Scenarios on the US Debt Overhang
Blog post
June 14, 2024
Key findings
- With the Congressional Budget Office projecting public debt rising from its current level of 95% of GDP to 116% of GDP over the next decade, some of investors’ focus might shift from monetary to fiscal policy.
- We examine two downside scenarios: one on the macroeconomic impact through higher rates and inflation and lower trend growth; the second where rich valuations in combination with a sentiment shock trigger a sell-off in risky assets.
- The potential impact on global equities could range from a 10% loss in the “macroeconomic impact” scenario to a 19% loss in the “risky-asset sell-off” scenario.
The initiation of the rate-hike cycle by the Federal Reserve in 2022 has positioned U.S. monetary policy as a major driver of financial markets. The projected surge in public debt may shift attention to fiscal policy, however. The Congressional Budget Office anticipates U.S. public debt could escalate to a record 116% of GDP over the next decade.[1] While a U.S. default is highly unlikely, historical instances of debt-ceiling tensions suggest potential market disruptions and expanding public debt could have further implications for the world's largest economy. This blog post explores two downside scenarios for financial markets as investors consider their path forward. The first considers potential macroeconomic effects and their portfolio impact and another that assumes deteriorating U.S. sovereign-debt levels and upward pressure on interest rates may hurt riskier assets and trigger a market sell-off. The potential repercussions on a portfolio of global stocks could vary from a 10% loss in the "macroeconomic impact" scenario to a 19% loss in the "risky-asset sell-off" scenario.
Are risky assets vulnerable?
Since the rate hikes started in 2022, nominal and real Treasury yields have surged after a two-decade decline. Rising sovereign-debt levels could be one of the reasons 10-year rates may not return soon to pre-pandemic levels. The question is whether sustained higher interest rates might hurt riskier assets like stocks and corporate credit through increased capital costs. As we noted in our previous blog post, equities are now relatively expensive compared to Treasury bonds and historical standards. Additionally, credit spreads are tight, leaving more room for losses in a market correction.
Nominal and real Treasury yields have surged; credit spreads are tight

Two scenarios for financial markets
Macroeconomic impact: Increasing investor concerns about surging sovereign debt push rates higher, raising borrowing costs for businesses and consumers. As the U.S. has a strong track record of managing its debt levels and has the advantage of issuing debt in its own currency, the impact on the economy could be relatively mild: The economy continues to grow, albeit at a slower pace, while inflation rises.[2]
Risky-asset sell-off: Rising rates in combination with a relatively expensive stock market and tight credit spreads could trigger a market sell-off if market sentiment changes. In this scenario, risk-off dynamics dominate and safe-haven assets such as Treasury bonds rally, while the equity sell-off is exacerbated compared to the macroeconomic scenario.[3]
Our scenario assumptions
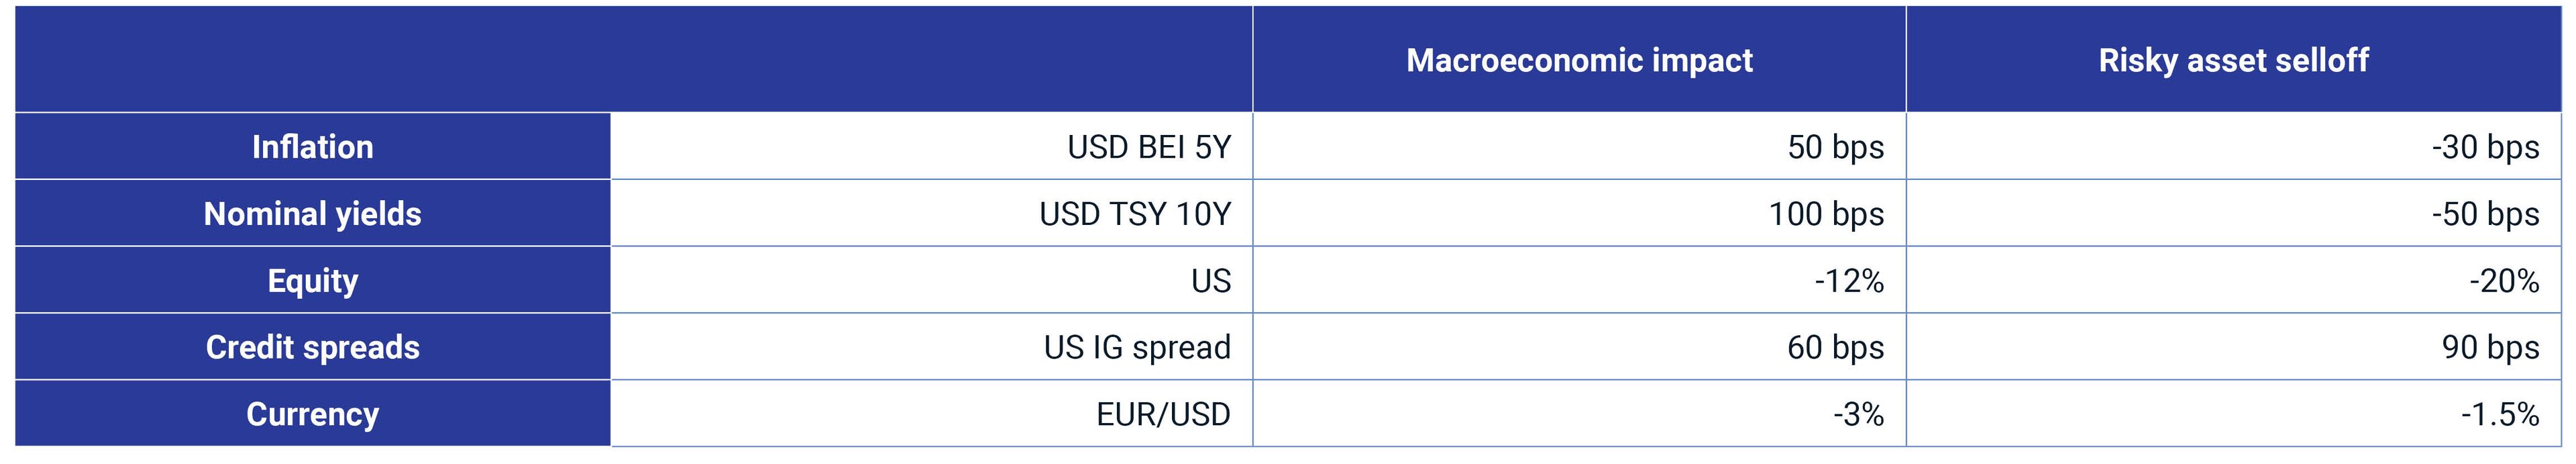
Scenario assumptions are informed by the MSCI Macro-Finance Analyzer, analysis of historical data and judgment. Breakeven inflation (BEI) is measured in basis points (bps). These are not forecasts, but hypothetical narratives of how the scenarios could affect multi-asset-class portfolios.
Potential implications for financial portfolios
To evaluate the scenarios' impact on multi-asset-class portfolios, we used MSCI's predictive stress-testing framework and applied it to a hypothetical portfolio consisting of global and U.S. equities, U.S. bonds and real estate.[4] Under the macroeconomic-impact scenario, the portfolio's value declined by 10%, while the risky-asset sell-off resulted in a 19% loss.[5] While in the former scenario all the asset classes experienced losses, under the latter scenario Treasurys provided slight offsetting gains against more significant equity losses. Detailed results are illustrated in the exhibit below.
Equity losses in a risky-asset sell-off partly offset by Treasury gains
Loading chart...
Please wait.
Portfolio impact of the scenarios based on market data as of May 27, 2024. Source: S&P Global Market Intelligence, MSCI
Long-term dynamics can have short-term implications
While investors have focused on the short-term monetary cycle, the implications of rising sovereign debt have been less scrutinized. In this blog post, we explored how markets might fare if the sovereign-debt level takes center stage, altering investors' macroeconomic expectations or market sentiment, potentially leading to a sudden financial-market repricing.
The authors thank Will Baker and Rick Bookstaber for their contributions to this blog post.


Subscribe todayto have insights delivered to your inbox.
1 “The Budget and Economic Outlook: 2024 to 2034,” Congressional Budget Office, Feb. 7, 2024.2 We used the MSCI Macro-Finance Analyzer to assess the implications of the shocks to trend growth and the 10-year Treasury yield for U.S. asset classes. We assumed average 10-year growth will be lower by 40 basis points compared to the baseline. For a discussion of the link between debt-to-GDP and growth, please see: Jaejoon Woo and Manmohar S. Kumar, “IMF Working Paper No. 10/174, Public Debt and Growth,” International Monetary Fund, July 1, 2010.3 We looked at historical corrections caused by changes in sentiment and fundamentals, including Black Monday — after the 2011 U.S. sovereign-debt downgrade — when equity markets dropped 19% and Treasury bonds rallied. We assumed similar dynamics, with a slightly more muted impact to Treasury yields due to the longer-term upward pressure on rates.4 Treasury inflation-protected securities are represented by the iBoxx TIPS Inflation-Linked Index provided by S&P Dow Jones Indices. U.S. Treasurys, equities and corporate bonds are represented by MSCI indexes. Private equity is represented by model portfolios. U.S. real estate is represented by the MSCI/PREA U.S. AFOE Quarterly Property Fund Index. The composite portfolio is 50% global equities, 10% U.S. Treasurys, 10% U.S. Treasury inflation-protected securities, 10% U.S. investment-grade bonds, 10% U.S. high-yield bonds and 10% U.S. real estate.5 The results are generated by using model correlations to propagate shocks to the portfolios, using MSCI's BarraOne®. MSCI clients can access BarraOne and RiskMetrics RiskManager® files for these scenarios on the client-support site.
The content of this page is for informational purposes only and is intended for institutional professionals with the analytical resources and tools necessary to interpret any performance information. Nothing herein is intended to recommend any product, tool or service. For all references to laws, rules or regulations, please note that the information is provided “as is” and does not constitute legal advice or any binding interpretation. Any approach to comply with regulatory or policy initiatives should be discussed with your own legal counsel and/or the relevant competent authority, as needed.