EAFE ADRs vs. Shares: How Do They Compare in Tax Efficiency?
Key findings
- We analyzed how the choice of using an American depositary receipt (ADR) versus the underlying security to add EAFE equity exposure to a client’s portfolio can affect its characteristics and tax efficiency.
- The security-count difference between the EAFE ADR and share universes plays a key role in their respective levels of turnover.
- Our analysis showed that U.S. wealth managers could use ADRs to construct tax-efficient portfolios to closely track EAFE benchmarks with only a modest impact on tracking error and with potentially lower turnover.
In March 2022, the MSCI EAFE Expanded ADR Index added level 1 American depositary receipts (ADRs) as constituents, thereby increasing its coverage to approximately 70% of the market capitalization of the MSCI EAFE Index. ADRs allow wealth managers to achieve broad international exposure without directly purchasing non-U.S. equities. The expanded coverage opened the door wider to U.S. wealth managers who choose ADRs to access international markets for their clients. How might the choice of ADRs versus shares impact the tax-efficient management of a U.S. taxpayer's international equity portfolio?
The framework of our analysis
To explore this question, we compared two hypothetical tax-aware strategies with two tax-agnostic strategies, using the MSCI EAFE Expanded ADR Index to represent a broad ADR universe and the MSCI EAFE Index to proxy a broad international-equity universe. The tax-aware strategies were constructed to minimize tracking error (TE) to the respective strategy's benchmark as well as tax liability, consistent with current U.S. tax law. The tax-agnostic strategies were designed to track the respective strategy's benchmark, disregarding tax considerations.[1]
Four strategies with EAFE equity exposure

During our analysis period, the MSCI EAFE Index tracked on average about 900 securities, whereas the MSCI Expanded ADR Index tracked about 350 ADRs. Thus, an EAFE share strategy could include many more securities than an EAFE ADR strategy. Our previous research showed that the number of a securities a portfolio holds can influence its turnover along with other characteristics such as tax efficiency. On average, the MSCI Expanded EAFE ADR Index has had ex ante tracking error of about 96 basis points (bps) to its parent index over the period from January 2018 through December 2023.[2]
Our analysis examined the turnover, tax efficiency and tracking error of the four strategies across a range of hypothetical portfolios with different security-count caps and holding periods. For the ADR strategy, those caps were 200, 300 and 400.[3] We looked most closely at the metrics for the four strategies with 300 distinct positions as a level that could apply to both the ADR and EAFE universes.
Turnover
Both tax-agnostic strategies had higher turnover than the corresponding tax-aware strategies.[4] The tax-aware strategies had fewer opportunities to trade because our analysis limited net realized gains. Lacking that restriction, the tax-agnostic strategies could trade more often.
Across all holding periods, the ADR strategies' turnover was lower than that of the share strategies for the portfolios capped at 200, 300 and 400 constituents. For 300 constituents, the tax-aware ADR strategy had turnover of 31% compared to 46% for the tax-aware share strategy. On average, the tax-aware ADR strategy had about 15% lower turnover than the tax-aware share strategy across all security counts.
EAFE ADR strategies had lower turnover than share strategies of similar constituent count
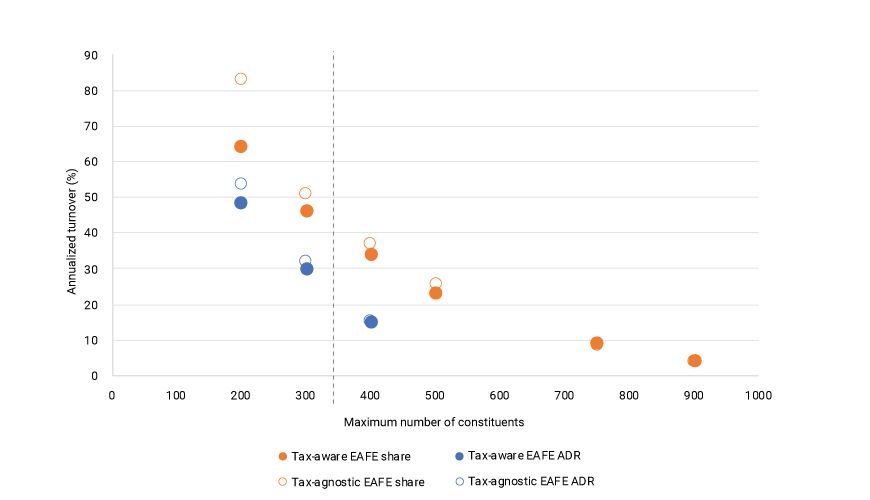
Data from January 2018 through December 2023. The data incorporates all holding periods studied in the analysis. The dotted line marks the approximate number of constituents in the MSCI Expanded EAFE Index.
When comparing the 200-, 300- and 400-count portfolios, the ADR strategies represented a larger proportion of the ADR universe than the share strategies did of the share universe. For example, an ADR portfolio with 300 holdings contained about 80% of the ADR universe, but the same size portfolio only contained about 30% of the share universe. Because an EAFE share strategy has a larger opportunity set for security selection than an EAFE ADR strategy, all else being equal, the former's turnover would likely be higher than the turnover of the latter.
Tax efficiency
Applying U.S. capital-gains tax rates, we analyzed the tax liabilities incurred by the four strategies. The tax-aware strategies, as defined in our analysis, did not incur any tax liability regardless of the security count. This outcome suggests that tax efficiency could be achieved for strategies using either EAFE ADRs or EAFE equities.
As the number of securities in the tax-agnostic strategies increased, the tax liability incurred as a percentage of the initial assets under management (AUM) decreased. Put another way, the tax efficiency of a strategy, whether implemented using ADRs or shares, tended to increase as the portfolio size increased, which commensurately improved the opportunity for tax-loss harvesting.
EAFE ADR strategies incurred less tax than share strategies of similar constituent count
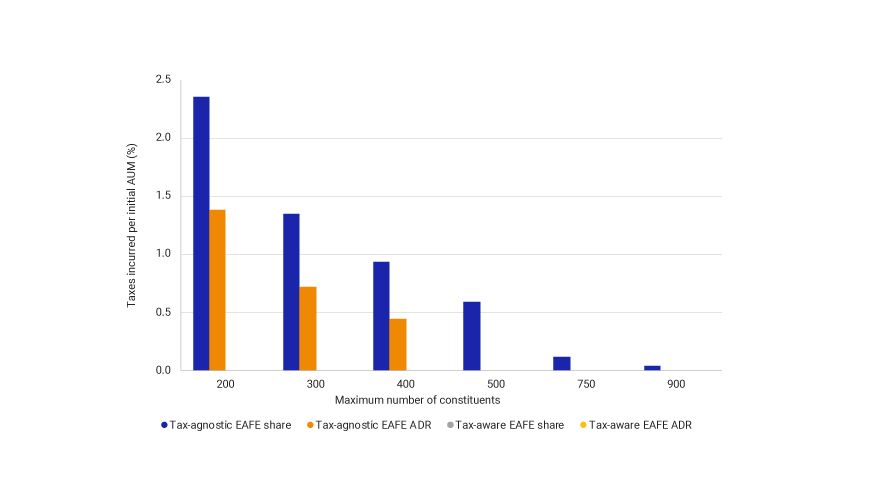
Data from January 2018 through December 2023. No bars are shown for the tax-aware strategies because the strategies do not incur any taxes in this analysis. The data incorporates all holding periods studied in the analysis.
We also found that the tax-agnostic ADR strategy incurred less in taxes than the tax-agnostic share strategy for portfolios of equal size due to the typically lower turnover of the ADR strategies. This finding indicates that a tax-efficient overlay on an ADR strategy, versus on a share strategy, might have a smaller impact on a portfolio's characteristics because an ADR strategy would have a lower tax liability to eliminate.
Tracking error
We next calculated the ex ante TE[5] of the four strategies versus the MSCI EAFE Index, across two dimensions. First, we compared the TEs of the tax-aware strategies and their corresponding tax-agnostic strategies. The TEs of both tax-aware strategies were the same as the TEs of their corresponding tax-agnostic strategies, which is consistent with our previous research. Thus, our analysis showed that tax efficiency appears achievable without incurring an increase in TE, using either EAFE ADRs or the underlying securities.
Higher tracking error of EAFE ADR strategies corresponded to smaller constituent count
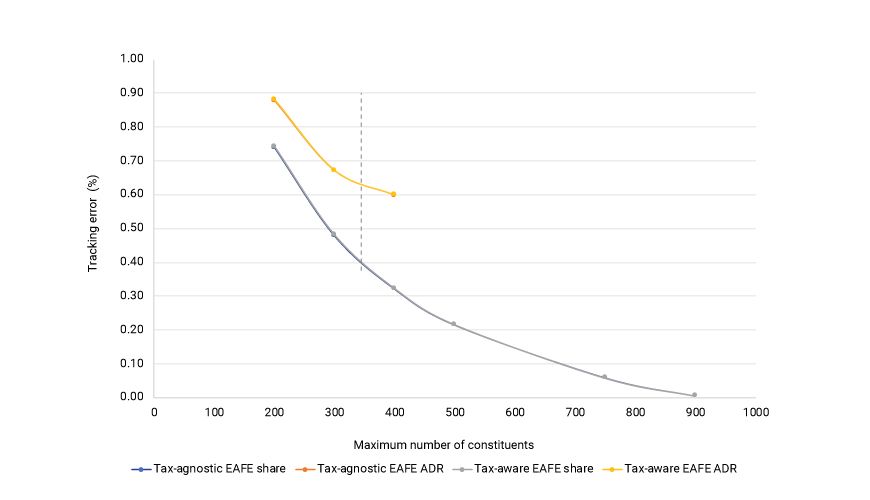
Data from January 2018 through December 2023. The lines for the tax-agnostic strategies and those for the tax-aware strategies are essentially the same, which explains why the blue and orange lines are not visible in the exhibit. The dotted line marks the approximate number of constituents in the MSCI Expanded EAFE Index. The data incorporates all holding periods studied in the analysis.
We also compared the TEs of the tax-aware share and ADR strategies for hypothetical portfolios of equal size. The TEs of the latter were higher than the TEs of the former in all three cases, primarily due to the securities in the MSCI EAFE Index that had no corresponding ADR. As the number of holdings in a strategy increased, the TE decreased because both the tax-aware and tax-agnostic strategies could track the benchmark more closely.
At 300 constituents, the ADR strategy had a TE of almost 70 bps versus the MSCI EAFE Index. This TE was 20 bps more than the share strategy's TE. Adjusting for this difference in security count between the ADR and share universes, we view the increase in TE as modest.
The bottom line
We found that U.S. wealth managers who seek to add EAFE equity exposure to their clients' portfolios could have done so over our analysis period in a tax-efficient manner using EAFE ADRs. The trade-off is slightly higher tracking error compared to a similar strategy implemented using the underlying EAFE securities. In addition, for the period we studied, the turnover of the tax-aware ADR strategies was lower than for the tax-aware share strategies.

Subscribe todayto have insights delivered to your inbox.
1 The four hypothetical strategies were funded by cash, rebalanced quarterly and have no transaction costs. The strategy portfolios were held for three years from their inception, with inception being Jan. 1 of each year. The analysis period began January 2018. We used the MSCI Global Equity Factor Model for Long-Term Investors (EFMGEMLT) and the Barra® Open Optimizer. The MSCI Expanded ADR Index incorporates frequency-of-trading and 12-month annual-traded-value ratio (ATVR) metrics when determining the applicable universe of ADRs to ensure the most liquid universe possible.2 Calculated using the EFMGEMLT.3 Because the cap of 400 was above the number of constituents in the MSCI EAFE Expanded ADR Index over the analysis period, the analysis for the ADR strategies at that constituent count were not practically impacted.4 Our analysis placed no turnover constraints on the strategies to isolate the effect that the investment universe — shares or ADRs — had on turnover.5 Tracking error was averaged across all holding periods and security counts for a given strategy.
The content of this page is for informational purposes only and is intended for institutional professionals with the analytical resources and tools necessary to interpret any performance information. Nothing herein is intended to recommend any product, tool or service. For all references to laws, rules or regulations, please note that the information is provided “as is” and does not constitute legal advice or any binding interpretation. Any approach to comply with regulatory or policy initiatives should be discussed with your own legal counsel and/or the relevant competent authority, as needed.