
Examining EM Asia Through a Sector Lens
- Companies with an AI-value-chain score above 10% make up 59% of the MSCI EM Asia Index's weight, and this exposure extends beyond IT into a majority of communication services and around half of consumer discretionary.
- Country weights can mask economic exposure: IT is concentrated in Taiwan and Korea but earns nearly half of its revenue in the U.S., so sector allocation can capture exposures a country lens misses.
- With sector dispersion in EM Asia at its highest in more than two decades, futures on MSCI EM Asia Sector Indexes allow institutional investors to adjust sector exposure directly.
Mentioned in this blog post:
Since the public launch of generative AI (Nov. 30, 2022), the MSCI EM Asia Index has returned 20.4% annualized in gross USD terms through Sept. 30, 2026, ahead of the MSCI EM Latin America Index (14.3%) and the MSCI EM EMEA Index (12.3%). Taiwan, China, Korea and India together accounted for more than 97% of the MSCI EM Asia Index, but most of its sectors are concentrated in one or two of these markets.1 Information technology is concentrated in Taiwan and Korea, while consumer discretionary and communication services are concentrated in China. As a result, overweighting or underweighting a sector also shifts exposure to those countries. EM Asia's sectors also differ in their sources of revenue and exposure to the AI value chain, and their returns have diverged more in recent years. Sector allocation can therefore be a useful complement to country allocation. We use sector indexes based on the Global Industry Classification Standard (GICS®) to show how EM Asia sectors differ in AI exposure, revenue sources and recent returns.2
IT's weight outpaces its share of risk and earnings
IT was the largest sector in the MSCI EM Asia Index at 49% as of Sept. 30, 2026, more than three times the weight of financials, the second-largest sector. Most of that rise came after November 2022, as semiconductors and semiconductor equipment grew from 13% to 30% of the index.
Comparing each sector's index weight with its share of index risk and earnings shows where these measures diverge. IT's share of index risk is well above its weight, at close to 70%, which means its returns are more volatile than the index's. Its share of index earnings is below its weight, at around 35%, which implies a higher price-to-earnings ratio than that of the index. Financials, energy and utilities show the opposite pattern, contributing more to earnings and less to risk than their weights suggest.
Data as of Sept. 30, 2026. The chart shows each sector's weight in the MSCI EM Asia Index compared with its share of index risk and its share of index earnings.
For sector allocators, this means that the effect of over- or underweighting a sector on portfolio risk and earnings can differ from the size of the position.
AI exposure extends beyond IT
Companies with a meaningful AI-value-chain score (score above 10) make up 59% of the MSCI EM Asia Index's weight, including almost all of IT.3 IT's largest companies — TSMC, Samsung Electronics and SK Hynix — are all tied to physical AI infrastructure through chips and memory. AI is therefore a source of exposure that cuts across sectors, though through different parts of the value chain: physical AI infrastructure in IT and digital infrastructure and applications in communication services and consumer discretionary.
AI-linked exposure also goes beyond IT. A majority of communication services and around half of consumer discretionary qualify, largely through platforms such as Alibaba, Tencent and Baidu, which build AI applications and digital infrastructure. Energy and industrials have smaller but still sizable shares, while the remaining sectors have almost none.
Data as of Sept. 30, 2026. The chart shows the share of sector weight with an AI-value-chain score above 10%.
Where sectors earn their revenue differs from where they are listed
IT is concentrated in two markets, with 57% in Taiwan and 35% in Korea, reflecting the size of their semiconductor and hardware companies. Consumer discretionary and communication services are mostly in China, reflecting its internet platforms, automakers and retailers, while materials and energy are split more evenly between China and India.
For geopolitical risks such as tariffs, or U.S.-China tensions, where a sector earns its revenue may matter more than where it is classified. MSCI Economic Exposure data estimates the share of a company's revenue earned in each market and region.4 The gap between where a sector is listed and where it earns revenue is widest for IT, which earns about half of its revenue in the U.S. This gap could be due to AI-linked demand from developed markets for firms such as TSMC, Samsung Electronics and SK Hynix. By contrast, consumer discretionary and communication services earn roughly two-thirds of their revenue in China, in line with their country weights.
Data as of Sept. 30, 2026. The chart shows the country weights and sources of revenue for each of the MSCI EM Asia Sector Indexes. Sources of revenue were calculated using MSCI Economic Exposure data and categorized as domestic, USA and International ex USA.
Sector dispersion is at a 20-year high
These differences between sectors have also shown up in their performance. Sector return dispersion, measured as the standard deviation of 12-month returns of sector indexes, stood at 20%, its highest level in more than two decades.5 Pairwise sector correlations show a similar trend. Compared with the time period from October 2016 to September 2021, IT has become less correlated with every other sector except industrials. This may partly reflect industrials' exposure to physical AI infrastructure. Consumer discretionary, communication services and real estate have become more correlated with one another.
For investors building EM Asia exposure through sectors, higher dispersion and lower cross-sector correlations between IT and other sectors mean that overweighting or underweighting a sector have a larger effect on performance relative to the regional index.
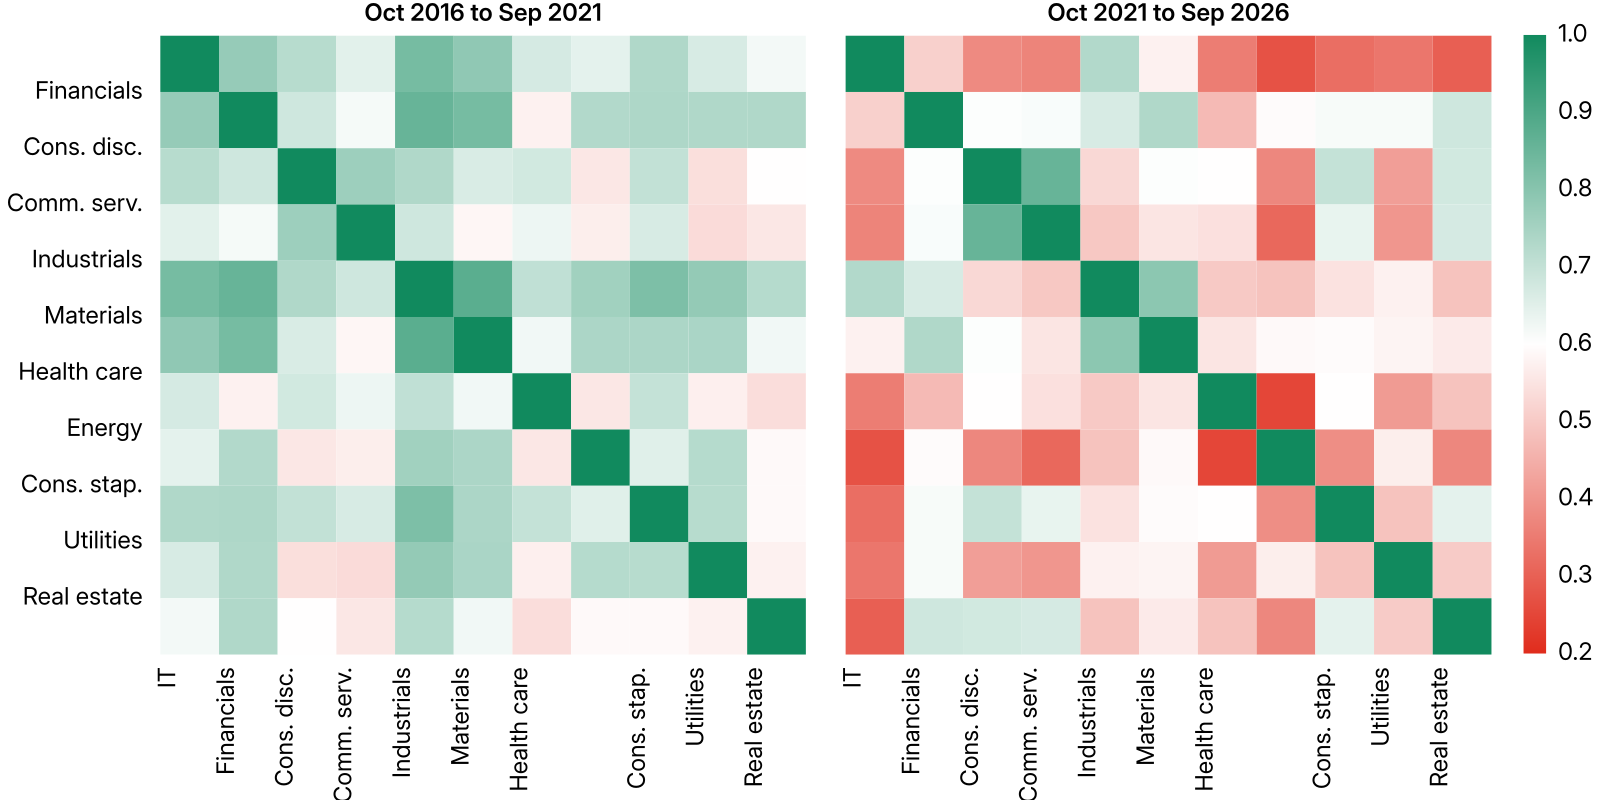
The above chart shows the pairwise weekly gross return correlations for the GICS sector indexes based on the MSCI EM Asia Index, compared across two five-year windows (October 2016–September 2021 vs. October 2021–September 2026).
Implications for EM Asia allocations
The MSCI EM Asia Index can be seen as a set of countries with different sector weights or as a set of sectors with different country weights. Because sectors group companies by business activity, which often cuts across countries, a sector allocation can target exposures that a country allocation may not isolate. Sector indexes give institutional investors a way to add to or trim such exposures within the region, for example AI-linked technology or Chinese internet platforms. Because sectors are concentrated in different markets, such adjustments also change country exposure. Futures on MSCI EM Asia Sector Indexes can be one way to implement them, alongside the cash equities or other instruments investors may already use.


Subscribe todayto have insights delivered to your inbox.
MSCI EM Asia Index
The MSCI Emerging Markets Asia Index captures large and mid-cap representation across Emerging Markets (EM) countries in Asia. The index provides broad exposure to Asian emerging economies by including securities from key markets such as China, India, Indonesia, Korea, Malaysia, Philippines, Taiwan, and Thailand. It is designed to reflect the performance of the equity universe in this dynamic region, offering investors insights into the economic growth and market developments within Asian emerging markets.
Mapping AI Exposure Across Global Markets
AI's geography is more distributed than headlines suggest — we map which economies lead each layer of the value chain and what that means for global equity investors.
Reassessing the Case for Japanese Equities
Japan's equities have beaten the rest of the developed world by 16% since 2025. We examine the underlying reasons and the trade-offs between the indexes used to gain that exposure.
1 As of Sept. 30, 2026.
2 GICS is the industry-classification standard jointly developed by MSCI and S&P Dow Jones Indices.
3 Each company is assessed for involvement in the AI value chain across 10 components representing the key nodes in the value chain, using segment revenue and attention from company news. The components span three layers: physical AI infrastructure (hardware for AI, AI data-center infrastructure and energy providers for AI), digital AI infrastructure (AI cloud compute, AI data infrastructure, AI model development, AI model training and AI deployment and operations) and AI applications (AI physical applications and software applications). A company's AI-value-chain score reflects its highest exposure across these components.
4 Using MSCI Economic Exposure data, we assess the portion of a company's global revenues from markets and regions worldwide. For more details, please refer to Economic Exposure in Global Investing.
5 As of Sept. 30, 2026.
The content of this page is for informational purposes only and is intended for institutional professionals with the analytical resources and tools necessary to interpret any performance information. Nothing herein is intended to recommend any product, tool or service. For all references to laws, rules or regulations, please note that the information is provided “as is” and does not constitute legal advice or any binding interpretation. Any approach to comply with regulatory or policy initiatives should be discussed with your own legal counsel and/or the relevant competent authority, as needed.