
How Asset Owners Can Recalibrate Their Climate Strategy
- Asset owners reviewing net-zero implementation can choose from a broad spectrum of approaches, from strict portfolio alignment to real-world decarbonization and transition opportunities — with scope to customize mandates.
- Paris-aligned strategies delivered the largest emissions cuts, largely through portfolio construction; the MSCI Energy Transition Index showed more decarbonization from companies’ own emissions reductions.
- Different climate approaches involve trade-offs across decarbonization, diversification and active risk, requiring investment teams to weigh climate objectives against broader portfolio priorities.
Mentioned in this blog post:
MSCI Energy Transition Index | MSCI's Energy Transition Framework | MSCI Climate Indexes | MSCI Climate Action Indexes | MSCI Climate Paris Aligned PAB Indexes
Net-zero climate commitments have anchored many asset-owner mandates for several years, supported by clear policy direction and a shared 1.5°C pathway. As implementation has matured, climate commitments have increasingly intersected with core investment considerations and the implications of maintaining strict alignment — such as tracking error and diversification — have become more apparent, while policy support has evolved unevenly across regions.1 Asset owners are therefore reassessing how to balance portfolio decarbonization with broader investment priorities, including a growing interest in real-world transition and technology opportunities. This shift is broadening the conversation around climate strategy beyond emissions toward a wider range of implementation choices that consider forward-looking climate risks and opportunities, alongside adjacent themes such as energy security and resilience.
The framework below illustrates this spectrum of approaches. Moving from left to right through the funnel shifts the emphasis from portfolio to real-world decarbonization, with greater flexibility to pursue alignment and opportunity-based approaches. Asset-owner mandates range from full alignment with a 1.5°C Paris-aligned pathway and ambitious climate targets to transition-based approaches that place greater emphasis on organic decarbonization, financial materiality and transition opportunities. The middle ground includes adjusting to a 2°C pathway or adopting benchmark-relative targets, allowing investment and climate teams to identify an approach within the climate spectrum appropriate for their evolving portfolio objectives.
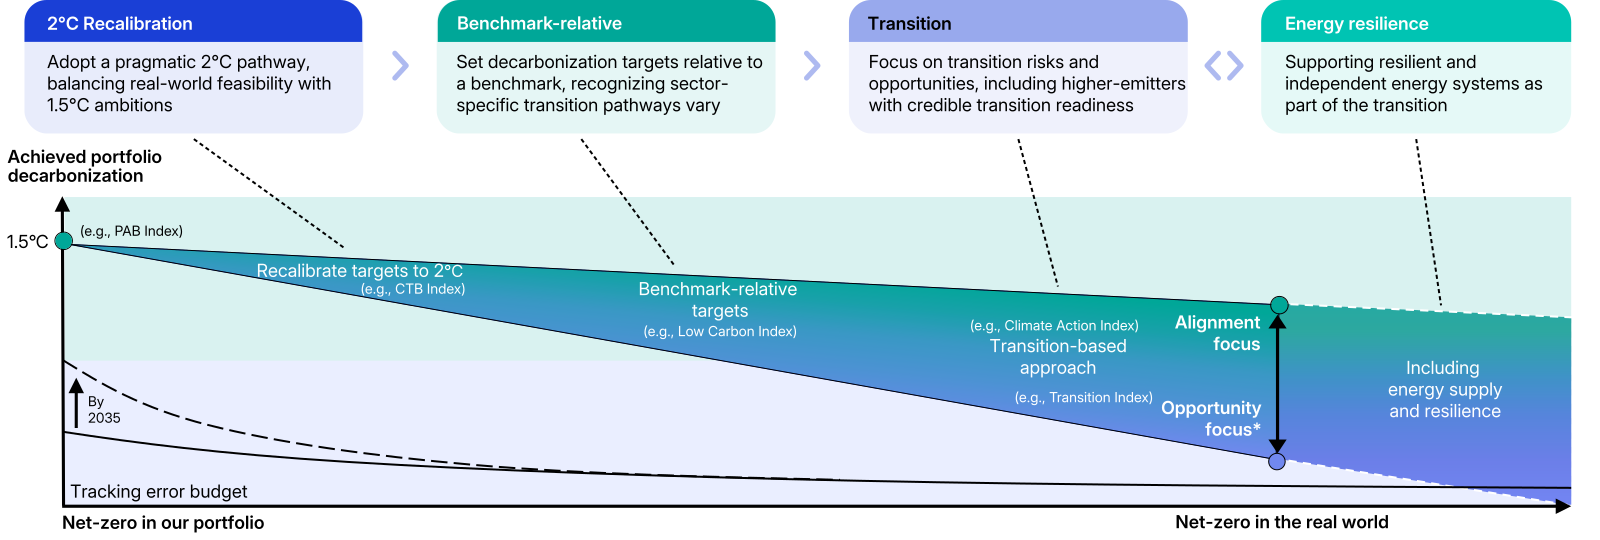
Source: MSCI Sustainability & Climate. MSCI Sustainability & Climate products and services are provided by MSCI Solutions LLC in the United States and MSCI Solutions (UK) Limited in the United Kingdom and certain other related entities. The climate journey shown is illustrative. Asset owners sit at different points on the climate spectrum and starting points may vary. *Emphasis on financial materiality and transition opportunities.
These implementation choices involve practical trade-offs; for example, how decarbonization is achieved differs materially across approaches.2 Market standards support Paris-aligned benchmark (PAB) and climate-transition benchmark (CTB) approaches, providing quantifiable annual emissions-reduction targets.3 In our emissions-attribution analysis, the MSCI ACWI EU PAB Index achieved the highest reduction in emissions intensity. Most of this reduction came from portfolio-construction effects, primarily divestments. In contrast, transition-based approaches, such as the MSCI Energy Transition Index, showed the largest contribution from real-world emissions cuts, reflecting exposure to higher-emitting sectors that may be positioned to benefit from or drive the transition.
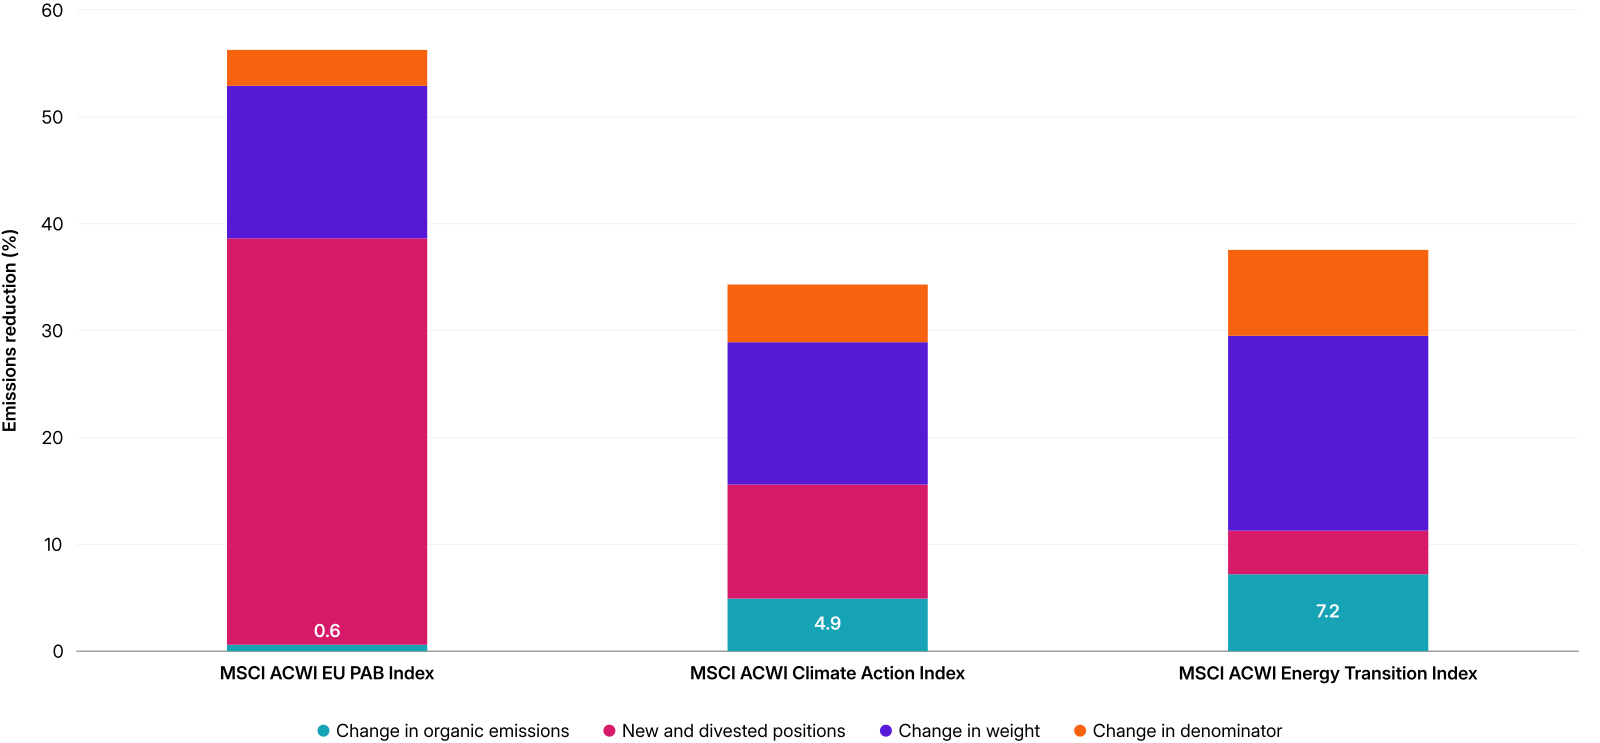
Source: MSCI Sustainability & Climate. Attribution of changes in Scope 1 and 2 financed-emissions intensity, by component, from Dec. 31, 2022, to Dec. 31, 2025. Chart shows the percentage reduction versus initial footprint. Results are simulated for the MSCI Energy Transition Index, which launched in September 2026. Organic emissions reduction relates to decarbonization from a company’s own operational decisions. For more information on the attribution methodology, please refer to this framework.
Trade-offs become more pronounced as decarbonization requirements compound over time. In a conservative simulation assuming no company-level emissions reductions, the number of eligible constituents in the MSCI World EU PAB Index fell from 717 to 277 over 10 years, while active risk rose from 1.23% to 2.43%. The simulated index nevertheless remained consistent with PAB requirements, supporting an ambitious portfolio-decarbonization pathway. If companies were to decarbonize organically, the resulting diversification and active-risk outcomes could be less pronounced.
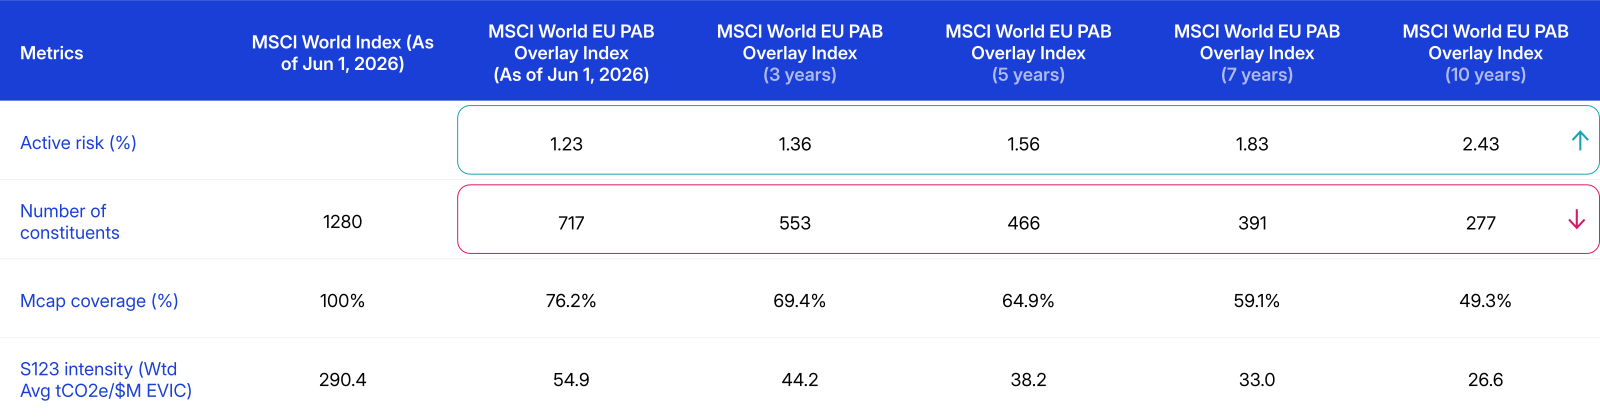
Source: MSCI Sustainability & Climate. The three-, five-, seven- and 10-year simulations take the June 2026 index review as the base reference and model the effect of applying 7% annual self-decarbonization targets over each respective period. The simulations are based on conservative “forward” simulations for which the parent index (MSCI World) had the same constituents throughout and no company-level emissions-intensity reductions occurred. The assumption of no emissions-intensity reduction over the 10-year period is relatively conservative. However, emissions intensity could continue to rise, and the simulation does not factor in special events like market crises that could impact calculations and risk estimates.
For asset owners, the question is therefore not simply how much to decarbonize a portfolio, but what form of climate implementation best suits their objectives. Some may continue to prioritize portfolio alignment with global climate targets. Others may place greater emphasis on real-world transition and financial objectives, constructing diversified portfolios around companies positioned to navigate transition risks and capture associated commercial opportunities, while taking into account a fragmented policy landscape.
For investment teams focused on transition opportunities, the opportunity set extends across sectors and technologies. For example, exposure to technology solutions can be identified across industries using MSCI’s Energy Transition Framework, supporting sector diversification. These opportunities go beyond just clean energy, from solutions for grid resilience (such as demand management and fuel cells) to battery storage. In simulated results, the recently launched MSCI Energy Transition Index also exhibited low tracking error (0.8%) and a market-like beta of 0.98, reflecting broad-market exposure.4
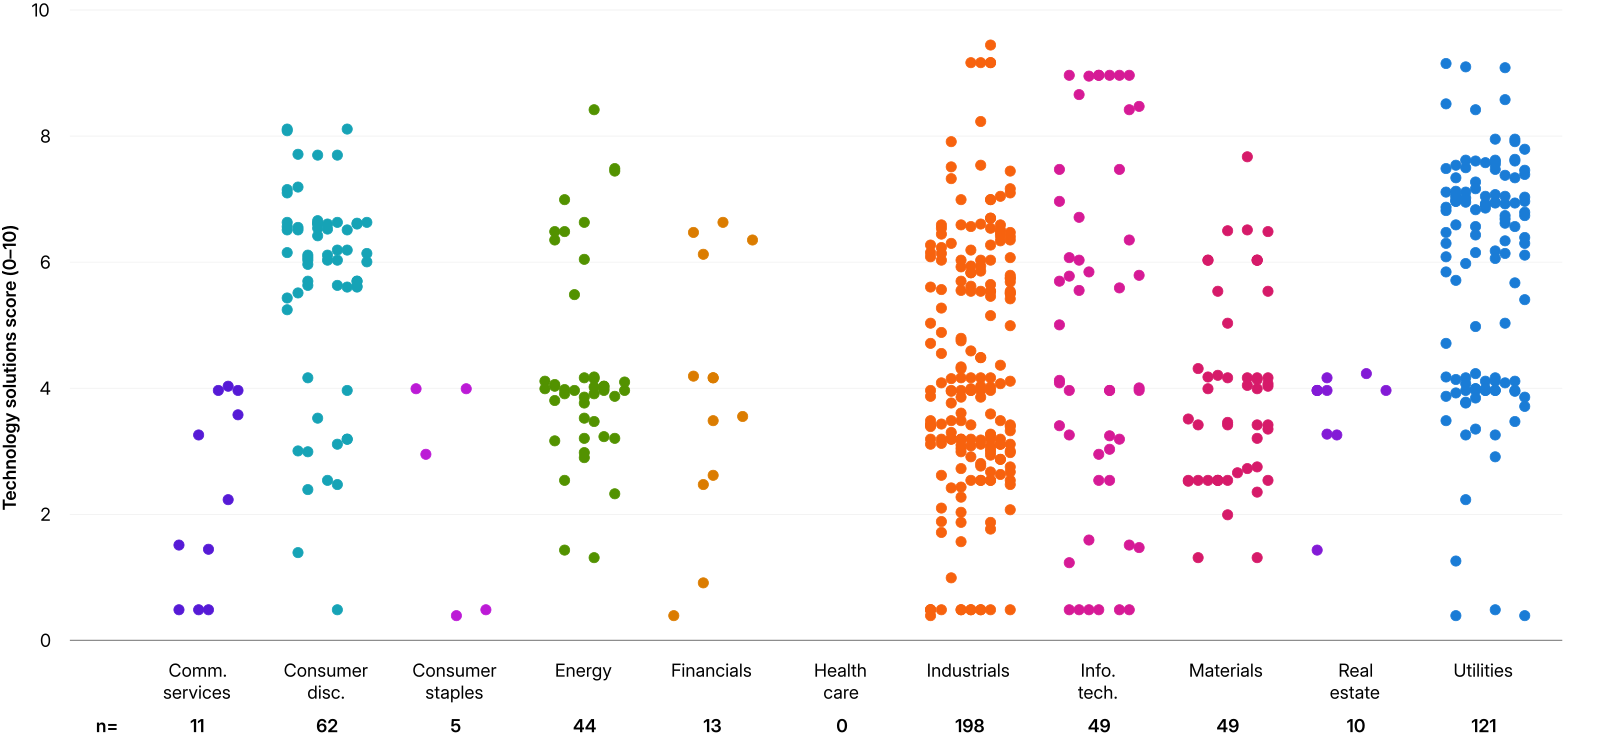
Source: MSCI Sustainability & Climate. Data as of Aug. 27, 2026. Each dot represents a company in the MSCI ACWI Index with a transition-solutions score above zero, where issuer-level data is available to make the assessment. The transition-solutions score is a component of MSCI's Energy Transition Framework. It measures a company's revenue exposure to alternative energy and energy-efficiency technologies, weighted by each technology's commercial readiness.
As climate strategies evolve amid a fragmented policy landscape, asset owners can draw on a range or combination of approaches to balance climate objectives with portfolio-construction considerations and fiduciary responsibilities. These choices involve trade-offs across the investable universe, risk budgets and the extent and type of decarbonization achieved. The framework below summarizes these trade-offs and presents key questions asset owners can consider to inform implementation choices and support conversations with boards and trustees. Ultimately, the appropriate approach will depend on each investor’s priorities, constraints and intended portfolio outcomes.
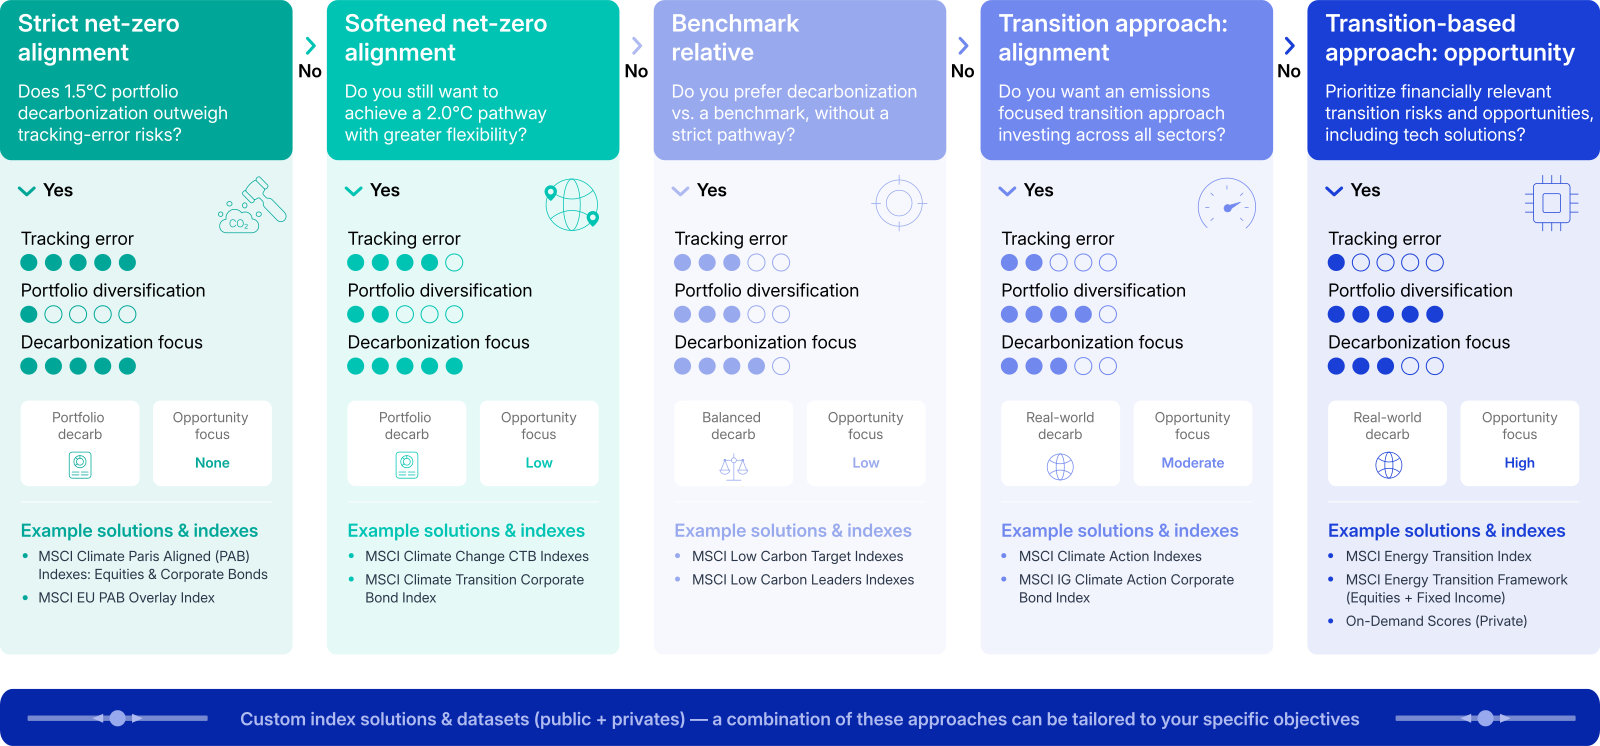
Source: MSCI Sustainability & Climate, as of August 2026. Dots are illustrative and indicate the relative level or emphasis of each criteria. MSCI can customize an index to meet specific requirements for these criteria. Organic emissions reduction relates to decarbonization from a company’s own operational decisions. Decarb represents decarbonization. MSCI Private Capital datasets are available to incorporate views on private assets, including transition opportunities. MSCI’s Total Portfolio Footprinting solution aggregates financed emissions across the whole portfolio to provide a total portfolio view on emissions.


Subscribe todayto have insights delivered to your inbox.
Managing the Energy Transition in Equities
Does transition readiness still pay off in a fractured policy world? We found that better-prepared companies outperformed and decarbonized faster — even as transition pressures shifted.
User Guide to MSCI’s Climate Metrics for the Energy Transition
Not all climate metrics measure the same thing. Our new guide helps investors identify the right metrics for the right objectives, from alignment to transition opportunities, and when to use them.
Energy Transition Index
Designed to represent companies positioned to manage energy transition risk, with market-like risk and return characteristics and customization options.
1 Alignment here refers to a portfolio’s adherence to a defined decarbonization pathway, such as net-zero commitments, and prescribed exclusion criteria relative to a reference benchmark, such as Paris-aligned and Climate-transition benchmarks.
2 Decarbonization can be driven by portfolio effects, such as changes in holding weights or market valuations, or by real-economy effects, where companies actually reduce their own emissions footprint.
3 EU PAB and CTB requirements under Commission Delegated Regulation (EU) 2020/1818 are defined on greenhouse gas intensity covering scope 1, 2 and 3 emissions, measured in tons of CO2 equivalent per USD million of enterprise value including cash (EVIC). PABs must achieve an initial intensity reduction of at least 50% versus the investable universe (30% for CTBs), followed by an average annual self-decarbonization of at least 7%.
4 Simulated results cover the period May 31, 2021, to May 29, 2026. The MSCI Energy Transition Index is built using the MSCI Energy Transition Framework dataset.
The content of this page is for informational purposes only and is intended for institutional professionals with the analytical resources and tools necessary to interpret any performance information. Nothing herein is intended to recommend any product, tool or service. For all references to laws, rules or regulations, please note that the information is provided “as is” and does not constitute legal advice or any binding interpretation. Any approach to comply with regulatory or policy initiatives should be discussed with your own legal counsel and/or the relevant competent authority, as needed.