Small Caps’ Big Story in China
Key findings
- In the China A shares market, small-cap stocks have outperformed their large-cap counterparts for the past two decades.
- A market-cap coverage approach to index construction versus a fixed-number approach, would have allowed investors to create products that more consistently captured small-size exposure in the expanding China A shares market.
- Small caps in the China A shares market include more growth-oriented companies in new-economy sectors, such as technology and health care, than midcap and large-cap stocks.
Small caps have historically outperformed their larger counterparts in both developed and emerging equity markets, especially after recessions. We found similar results in the China A shares market. China small caps, proxied by the MSCI China A Onshore Small Cap Index, had a 9% active return over midcaps and large caps, represented by the MSCI China A Onshore Index, in the first half of 2023 and outperformed by 3.4% annually over the last approximately 18 years.
China A small caps did, however, have considerably higher annualized volatility than larger stocks, as the following exhibit shows. In comparison to other emerging markets, China's domestic small caps' annualized return premium was 1.9% higher. Over the same period, developed-market small caps posted no active return premium.
China small caps' have outperformed domestic larger caps

Annualized return and risk are calculated based on the monthly return of the MSCI China A Onshore Large Cap, MSCI China A Mid Cap and MSCI China A Small Cap Indexes from January 2005 through July 2023. Bubble size represents each segment's total market capitalization in USD trillion as of July 31, 2023.
China A shares' developing depth and breadth
For anyone who may not have been watching, the landscape of the China A shares market has been changing rapidly. As a result of market reform, including the ChiNext board, STAR board[1] and a registration-based IPO system,[2] as well as support for entrepreneurship and innovation,[3] the number of A shares increased to 5,030 as of July 2023 from 1,349 in January 2005. A significant portion of the new listings were small-cap firms, expanding the depth and scope of the segment.
Based on MSCI's Global Investable Market Index methodology framework, the MSCI China A Onshore Index and MSCI China A Onshore Small Cap Index include securities ranked between 0-85% and 85%-99% market coverage, respectively, based on cumulative free-float-adjusted market capitalization. This segment-target approach allows the number of index constituents to change automatically as the broad, rapidly changing market expands.[4] In contrast, the market coverage of a top-n-stocks approach shrinks as the market expands. The following exhibit illustrates this declining coverage.
China A shares: Shrinking coverage in a fixed-number approach to index construction

The China A shares universe and investable A shares are proxied by the MSCI China A Onshore Investable Market Index (IMI). The top 300, top 800 and top 1800 are hypothetical index simulations and are composed of the largest 300, 800 and 1800 stocks in the MSCI China A Onshore IMI. The data period is from January 2005 through July 2023.
The market-coverage approach has produced a transparent and size-consistent index. Over our analysis period from January 2012 to July 2023, the free-float-adjusted market-cap-coverage approach maintained stable exposure, around -2.0, to the CNLT size factor.[5] In contrast, the simulated indexes with a fixed number of constituents displayed notable size drift. For example, a hypothetical A500 simulation moved closer to a large-cap bias from a midcap bias, and a hypothetical A1000 simulation migrated toward midcaps from small caps.
Free-float-adjusted coverage approach has had stable small-cap exposure

* Stocks that had a long-term suspension in 2017 were excluded by the 2018 index reviews. To construct the A500 simulation, we used the 301st to 800th largest stocks in the MSCI China A Onshore IMI, and for the A1000 simulation, the 801st to 1800th largest stocks. The small-cap index constructed using the free-float-adjusted approach is proxied by the MSCI China A Onshore Small Cap Index. Size exposure is calculated at the end of each year and end of July 2023 using the CNLT model.
As of July 31, 2023, the Global Industry Classification Standard (GICS®)[6] industrials, information-technology, materials and health-care sectors had a 70% weight in the small-cap segment of the China market. High-tech enterprises, especially smaller ones, have been singled out for stepped-up financial support from the Chinese government.[7] The free-float market-cap-coverage approach also captured a broader swath of companies from niche industries, such as data processing and outsourced services.[8]
Megatrends, such as robotics, smart cities, nextgen internet, digital economy and disruptive tech, were also strongly represented in the small-cap segment.
Small-cap segment had higher weight in new-economy and technology sectors…

Based on the MSCI China A Onshore IMI as of July 31, 2023.
… and themes
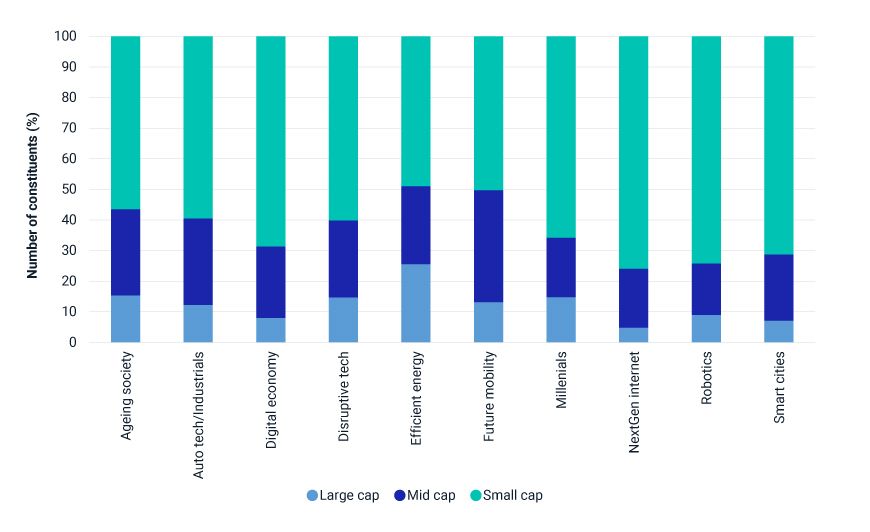
Based on the MSCI China A Onshore IMI as of July 31, 2023.
The scope and depth of the small-cap segment in China A shares has evolved and expanded quickly in recent years. Compared to larger stocks in the domestic market, the segment had the largest weight in high-tech and innovative industries. The market-cap-coverage approach to index construction provided a more comprehensive and stable small-cap set of constituents than the fixed-number approach, while balancing liquidity and investability characteristics.
The author would like to thank Shuo Xu and Yolanda Wang for their contributions to this blog post.

Subscribe todayto have insights delivered to your inbox.
1 ChiNEXT is a subsidiary of the Shenzhen Stock Exchange that focuses on mid- and small-sized start-up firms. The Shanghai Stock Exchange Science and Technology Innovation Board, or STAR, focuses on science and technology start-ups.2 “China expands IPO reform to help companies raise capital,” Reuters, Feb. 1, 2023.3 “State-level new areas to thrive through reform, innovation,” People's Republic of China, Jan. 17, 2020.4 For example, the number of constituents in the MSCI China A Onshore Small Cap Index has risen by more than seven times (to 2,700 from 362 constituents) since 2004, increasing liquidity in the market. The aggregated annualized trading-value ratio (ATVR) of China A-share small caps is about 13 times that of their counterparts in emerging markets and more than eight times higher than that of domestic larger caps. ATVR is used to measure liquidity.5 The CNLT is the Barra China A Total Market Equity Model for Long-Term Investors. The model enables investors to forecast risk and construct portfolios with China A shares.6 GICS is the global industry classification standard jointly developed by MSCI and S&P Global Market Intelligence.7 “Nation to bolster technology financing,” China Daily, July 28, 2023.8 For example, the MSCI China A Onshore Small Cap Index included stocks from 127 GICS subindustries, 13% more than that of a hypothetical simulation based on the 801st to 1800th largest stocks, as of July 31, 2023.
The content of this page is for informational purposes only and is intended for institutional professionals with the analytical resources and tools necessary to interpret any performance information. Nothing herein is intended to recommend any product, tool or service. For all references to laws, rules or regulations, please note that the information is provided “as is” and does not constitute legal advice or any binding interpretation. Any approach to comply with regulatory or policy initiatives should be discussed with your own legal counsel and/or the relevant competent authority, as needed.