
Sustainability Indexes in Focus: Where the AI Trade Left Each Index
- Four of the five MSCI ACWI Sustainability Indexes outperformed their parent index over the 12 months to June 2026. The MSCI ACWI Universal Index led at +1.65%; the MSCI ACWI Selection Index was the only laggard, at -0.50%.
- For investors comparing these indexes, decomposing performance along the AI value chain tells a fuller story: semiconductors lifted every index; hardware and software separated the rest.
- SRI and Selection use the same sustainability selection at different depths (top 25% vs. top 50%); investors should check what each depth implies and not just its stated objectives.
Mentioned in this blog post:
MSCI ACWI Universal Index | MSCI ACWI SRI Index | MSCI ACWI Selection Index
The 12 months to June 30, 2026 amounted to an AI year, just not the one investors had grown used to. Capital rotated from the companies that build AI models to those that build the infrastructure those models run on: memory, foundries and equipment. No index's sustainability objective, whether exclusionary screening or managing sustainability-related risks, directly determined its position in that rotation. Each index still had implicit exposures within the sector, which determined which part of the AI trade it held.
Each index met its sustainability objective, with widely varied performanceWe analyzed the performance of all five MSCI ACWI Sustainability Indexes June 30, 2025, through June 30, 2026. The MSCI ACWI Universal Index produced the highest active return — 1.65%, with a 1.14% tracking error (TE). The MSCI ACWI Focus Index delivered 0.94% excess return with 0.82% TE, the lowest TE. Its optimization approach helped it reach the second-highest ESG score of the five without deviating far from its parent, the MSCI ACWI Index.1
The two indexes sat at opposite ends of performance despite using the same selection method applied at different depths. The MSCI ACWI SRI Index, which selects the top 25% of companies by sustainability score within each sector, outperformed by 1.20%. The MSCI ACWI Selection Index, which selects the top 50%, underperformed by 0.50%. Each index met its sustainability objective. Index-level ESG scores ranged from 6.87 to 8.27 across the five against 6.85 for the parent index.2
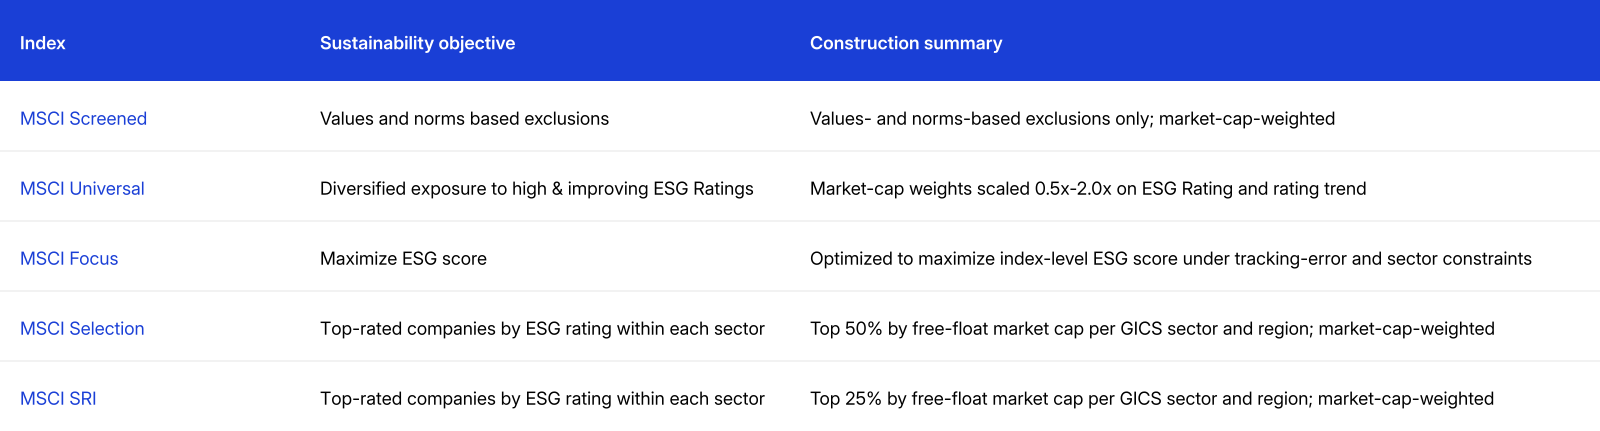
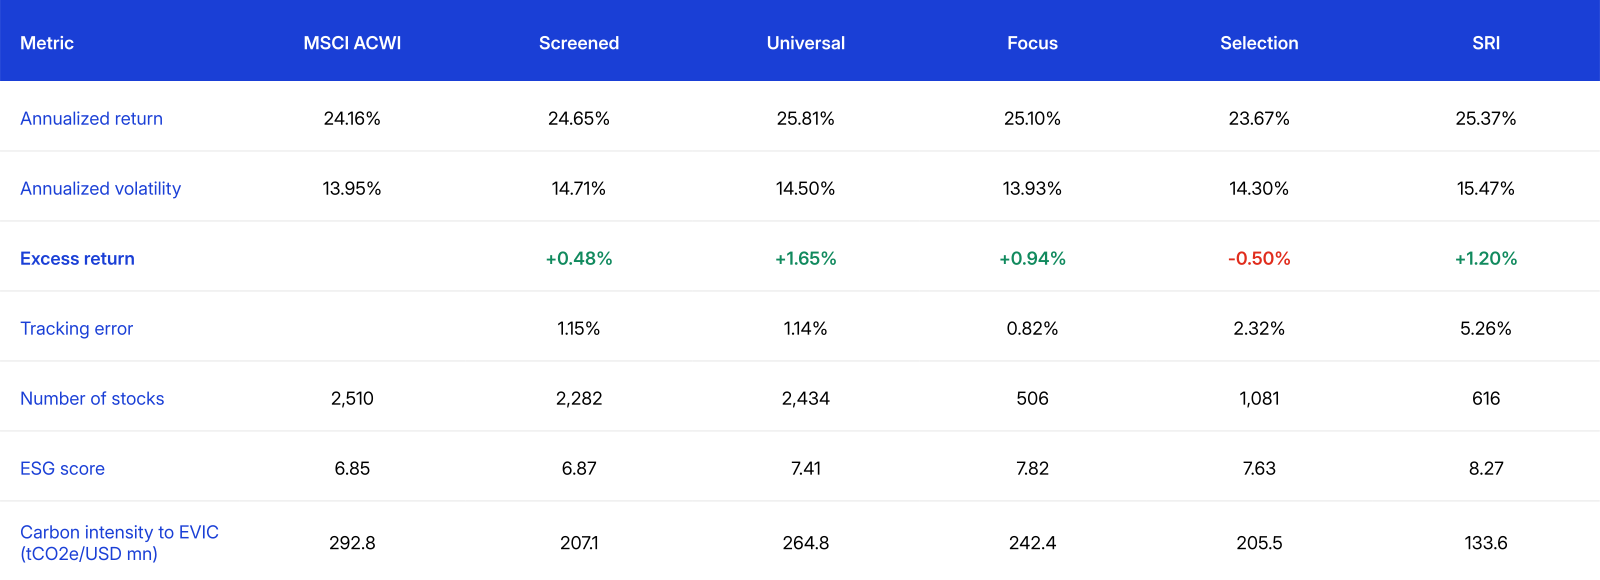
Data from June 30, 2025, to June 30, 2026. Returns in USD, gross. Carbon intensity measured as Scope 1+2+3 emissions relative to enterprise value including cash (EVIC).
Three layers of the AI value chain decided the period: chip design and equipment, the hardware that chips go into and the software running on top of both. Each sits in a different Global Industry Classification Standard (GICS®) industry group (semiconductors, technology hardware and software and services, respectively) and each moved differently: 104%, 80% and -24%. These indexes pick stocks within each sector, so sector weights stayed close to the parent.3
Every index was overweight semiconductors, and MSCI ACWI SRI held the largest position, accounting for a 9.68% gain. Technology hardware and software and services decided the ranking. MSCI ACWI Selection was underweight technology hardware and overweight software and services, leading to a loss of 3.68% and 1.38% respectively. MSCI ACWI Focus took almost none of these implicit industry exposures, given its low TE budget.
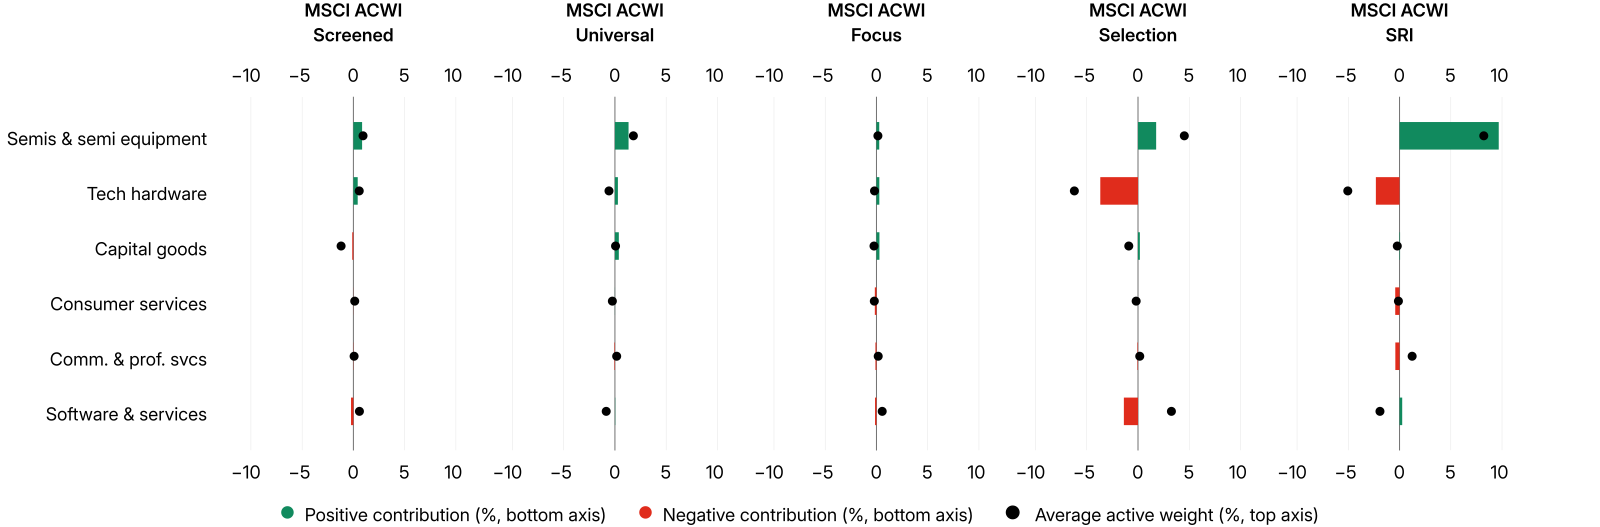
Data from June 30, 2025, to June 30, 2026. Returns in USD, gross. The chart shows the active exposure to the three best- and three worst-performing GICS industry groups in the MSCI ACWI Index over the period, selected by industry-group return, and the aggregate active performance from the securities from those industry groups.
The chart walks through each index's constituents from largest to smallest, showing where overweight and underweight positions added to or took away from performance. MSCI ACWI Selection's wider selection rule was enough to hold several of the year's largest gainers, including Alphabet Inc. and NVIDIA Corp., and both added to early performance. That edge narrowed further down the list, where underweights in other large and mid-sized names, Apple Inc. chief among them, gave most of it back.
Alphabet cleared the top 50% cut within its sector but not the top 25%, leaving MSCI ACWI SRI with an underweight that detracted early in the period.4 The index held larger overweights than MSCI ACWI Selection in Advanced Micro Devices, Inc., Intel Corp. and Applied Materials Inc., and those positions accounted for the recovery.
The Selection and SRI indexes diverged on individual stocksData from June 30, 2025, to June 30, 2026. Returns in USD, gross.
How to use this chart: Click on the individual index name to see the returns over the time period. Hover over each dot in the chart to see the active weight and performance contribution of each security named.
The performance of the MSCI Sustainability Indexes reflected implicit industry exposures and stock-level positions that followed from the eligibility criteria rather than from any view on the market. In a narrow market, a small number of securities can account for most of a headline active return, so a modest active weight in one of them could become material. When a single theme sets market direction — as we have seen during the period — sustainability-focused investors should monitor their implicit industry exposures from their chosen methodology as that may impact short-term performance.



Subscribe todayto have insights delivered to your inbox.
Sustainability Indexes
MSCI Sustainability Indexes equip institutional investors with tools to integrate extra financial considerations into their investment process and portfolios.
Understanding MSCI ESG Indexes: Methodologies, Facts and Figures
We explore the methodologies behind the MSCI ESG Indexes to see how they integrate ESG considerations. We also assess the differences of these approaches in terms of the financial and ESG characteristics to understand potential trade-offs.
Mapping AI Exposure Across Global Markets
AI's geography is more distributed than headlines suggest — we map which economies lead each layer of the value chain and what that means for global equity investors.
1. ESG scores are calculated as the industry-normalized, weighted average of a company's individual environmental, social and governance key Issue scores, producing a final score on a 0–10 scale.
2. The sustainability objective of each index, and the considerations behind selecting one over another, are set out in our previous research paper: "Understanding MSCI ESG Indexes: Methodologies, Facts and Figures," MSCI, October 2023.
3. GICS is the industry-classification standard jointly developed by MSCI and S&P Dow Jones Indices.
4. Alphabet was ineligible for the MSCI ACWI SRI Index on both its MSCI ESG Rating and its MSCI ESG Controversies Score.
The content of this page is for informational purposes only and is intended for institutional professionals with the analytical resources and tools necessary to interpret any performance information. Nothing herein is intended to recommend any product, tool or service. For all references to laws, rules or regulations, please note that the information is provided “as is” and does not constitute legal advice or any binding interpretation. Any approach to comply with regulatory or policy initiatives should be discussed with your own legal counsel and/or the relevant competent authority, as needed.