
Water Scarcity: Who Picks Up the Bill?
- Water scarcity could cost companies an estimated USD 485 billion annually, based on analysis drawing on 25 years of documented drought-related financial losses.
- For equity and fixed-income investors, absolute financial losses can obscure where water-scarcity risk concentrates. Loss relative to revenue and business activity provides a clearer picture.
- Assessing direct operations alone risks missing supply-chain exposure. Water scarcity can raise costs even for companies outside drought-affected regions.
Mentioned in this blog post:
Another year, another round of drought headlines. Heatwaves and missing rainfall have withered crops,1 disrupted manufacturing and hydropower output2 and left the media running dry on new superlatives to describe this latest round of "one-in-50-year" or "record-breaking" droughts.3
The financial fallout from this year's lack of rain is still being tallied, but earlier droughts show how costly a shortage can become. Like the 2012 U.S. drought, for example: USD 44.8 billion in economic losses as crops failed and livestock production suffered.4 Or the Rhine in 2018, when low water levels disrupted raw-material deliveries to BASF SE, costing the company some USD 379 million in earnings.5 Or the 2022 drought in China, where hydropower shortages forced aluminum producers to cut output — including almost 13,000 tons across just two smelters.6
Acknowledging that these droughts are happening and are projected to become more frequent and severe is one thing. Allocating the financial fallout from the resulting water scarcity is another.
Putting a price on water scarcity
We reviewed financial impacts from almost 50 droughts across more than 40 geographies and five affected sectors over 25 years. The separate company-portfolio analysis below spans all 11 Global Industry Classification Standard (GICS®) sectors.7 Across these events, we assembled almost USD 300 billion in documented financial losses that could be linked to specific drought events, sectors and geographies. We accounted for changing drought patterns and applied the resulting loss rates to companies' asset locations and supply chains, estimating both revenue losses from disrupted operations and higher input costs passed on by affected suppliers — ultimately determining who gets which share of the bill. The chart below shows how widely those losses varied across events and industries.
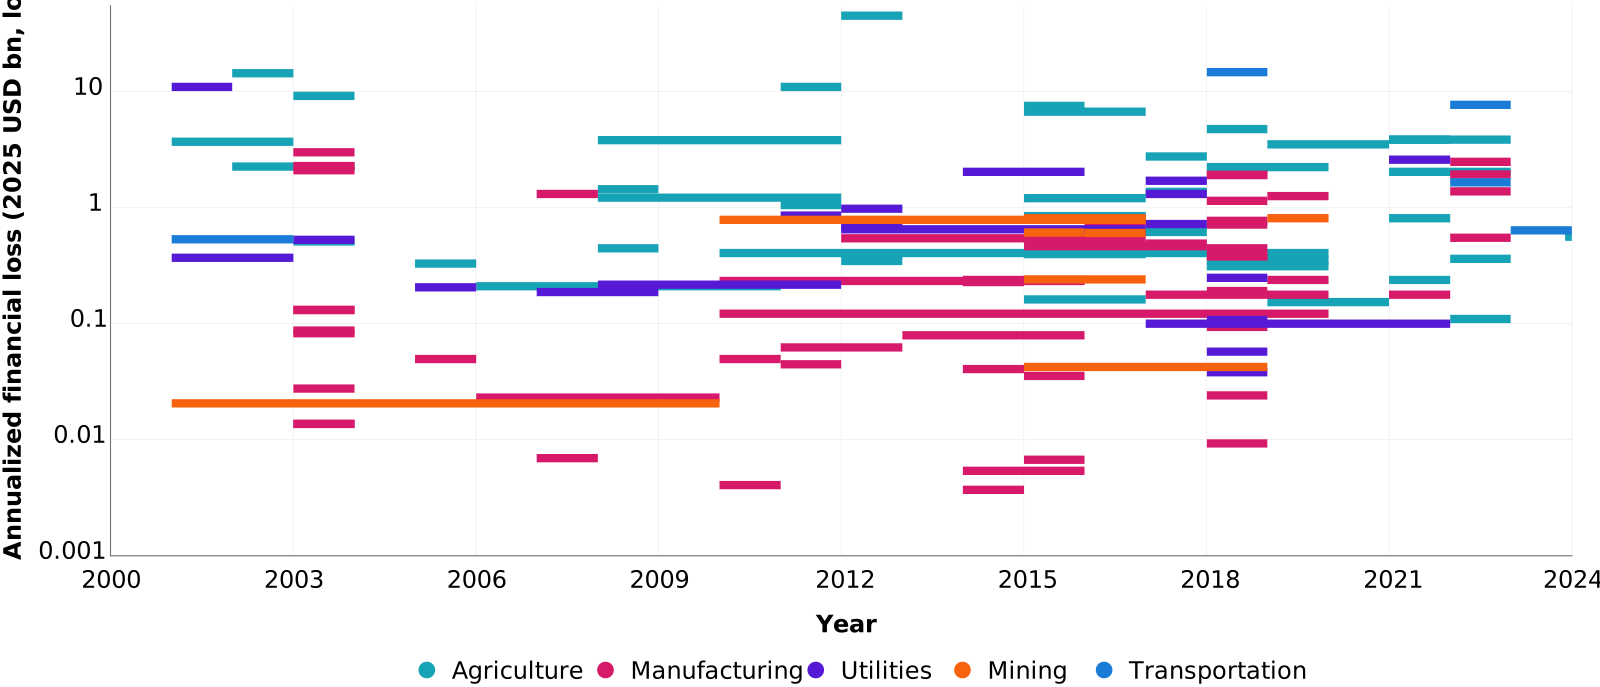
Data as of March 2026. Annualized losses in 2025 USD (logarithmic scale). Each line represents a sector- and geography-specific observation over a drought event. Source: MSCI Sustainability & Climate. MSCI Sustainability & Climate products and services are provided by MSCI Solutions LLC in the United States, MSCI Solutions (UK) Limited in the United Kingdom, MSCI Solutions (Deutschland) GmbH in the EU and certain other related entities.
Earlier analysis estimated an annual water-scarcity bill of USD 485 billion across 9,500 listed equity and fixed-income issuers. The total is a starting point; for investors, the questions are which companies bear the costs, where the exposure lies and how large it is.
Separating the bill
Consider a hypothetical portfolio of 349 real-world issuers, drawn mainly from the largest companies by annual revenue in each of the 11 GICS sectors, generating more than USD 10.5 trillion in annual revenue from more than 220,000 assets worldwide.
Across that portfolio, estimated annual losses from water scarcity total roughly USD 112.5 billion. Around 80% stems from revenue lost when water scarcity disrupts companies' own operations. The remaining 20% comes from higher input costs as affected suppliers pass some of their own losses downstream, as illustrated below. The split looks different across sectors, however, with utilities particularly exposed through direct operations and upstream costs playing a bigger role for energy companies.
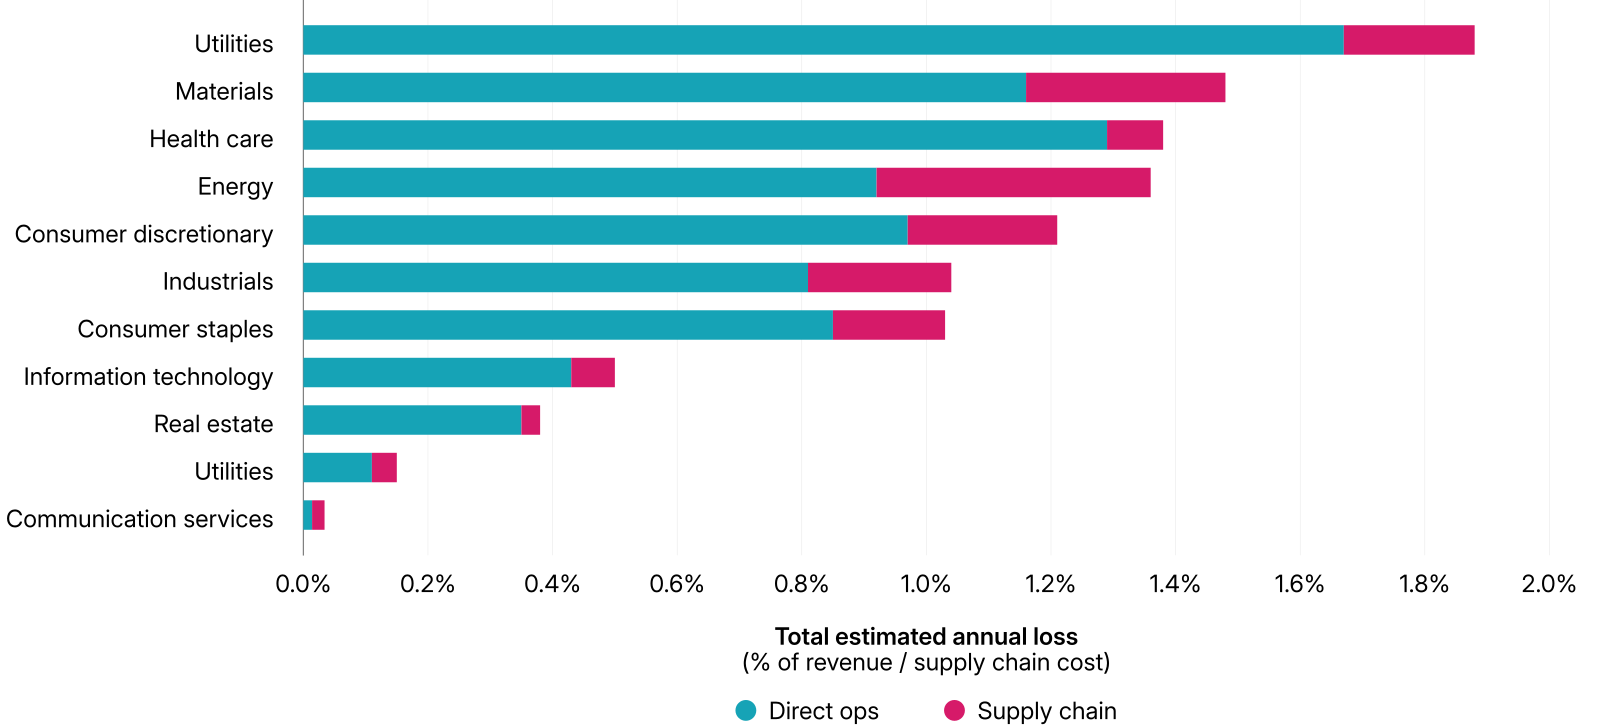
Data as of July 2026. Estimated annual losses by sector and source through 2040, as a percentage of annual revenue / supply-chain cost, for the hypothetical portfolio.
Direct operations: The largest loss isn't always the hot spot
In raw numbers, the U.S. leads estimated annual operational losses due to water scarcity in the hypothetical portfolio with almost USD 19 billion, followed by France at nearly USD 7 billion. Germany also records substantial losses across manufacturing, production and refining.
But these at-a-glance totals often reflect where a portfolio does business rather than where risk concentrates. The next chart depicts this with two measures: Bubble size shows the estimated annual loss in USD at each asset, while darker country shading indicates higher losses relative to the revenue generated there.
Looking at losses relative to revenue, and drilling further into individual activities, changes the picture. Germany's USD 1.8 billion in estimated annual manufacturing losses represents a below-average loss rate, while Spanish hydropower faces disproportionately high losses despite accounting for just 0.15% of the hypothetical portfolio's revenue we analyzed.8 The U.S. falls somewhere in between, combining a large revenue base with slightly above-average loss rates.
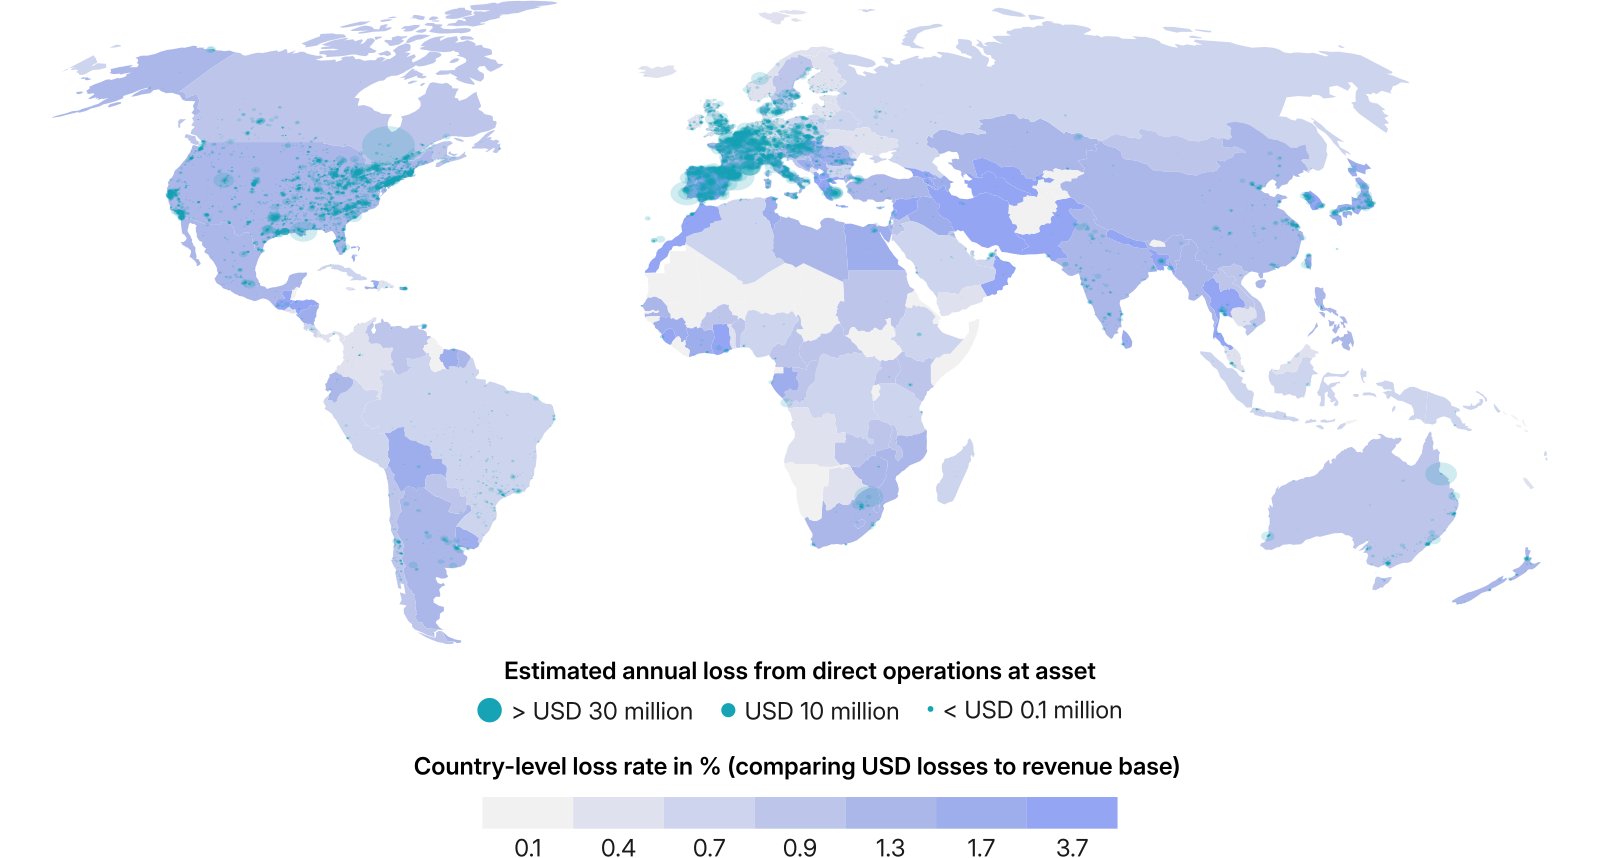
Data as of July 2026. Bubble size represents estimated annual losses through 2040 at individual assets; country shading shows losses relative to revenue. Source: MSCI Sustainability & Climate
The supply chain charges extra
Water scarcity doesn't stop at direct operations. Affected suppliers may pass higher production costs to businesses whose own operations face no water shortages. Across our hypothetical portfolio, increases in supply-chain costs accounted for around USD 22.7 billion in expected annual losses — roughly 20% of the total portfolio impact.
In absolute terms, energy bears the largest supply-chain-cost increase (USD 5.7 billion), driven mainly by oil and gas extraction and petroleum refining, as shown below. Industrials, consumer discretionary and materials receive their largest losses from their manufacturing suppliers (USD 4.6 billion, USD 4.2 billion and USD 2.5 billion, respectively), showing how water dependency can travel well beyond the sector where it originates.
Geographically, Saudi Arabia and China (USD 1.1 billion and USD 1.7 billion, respectively) emerge as additional hot spots missed by direct operations alone.
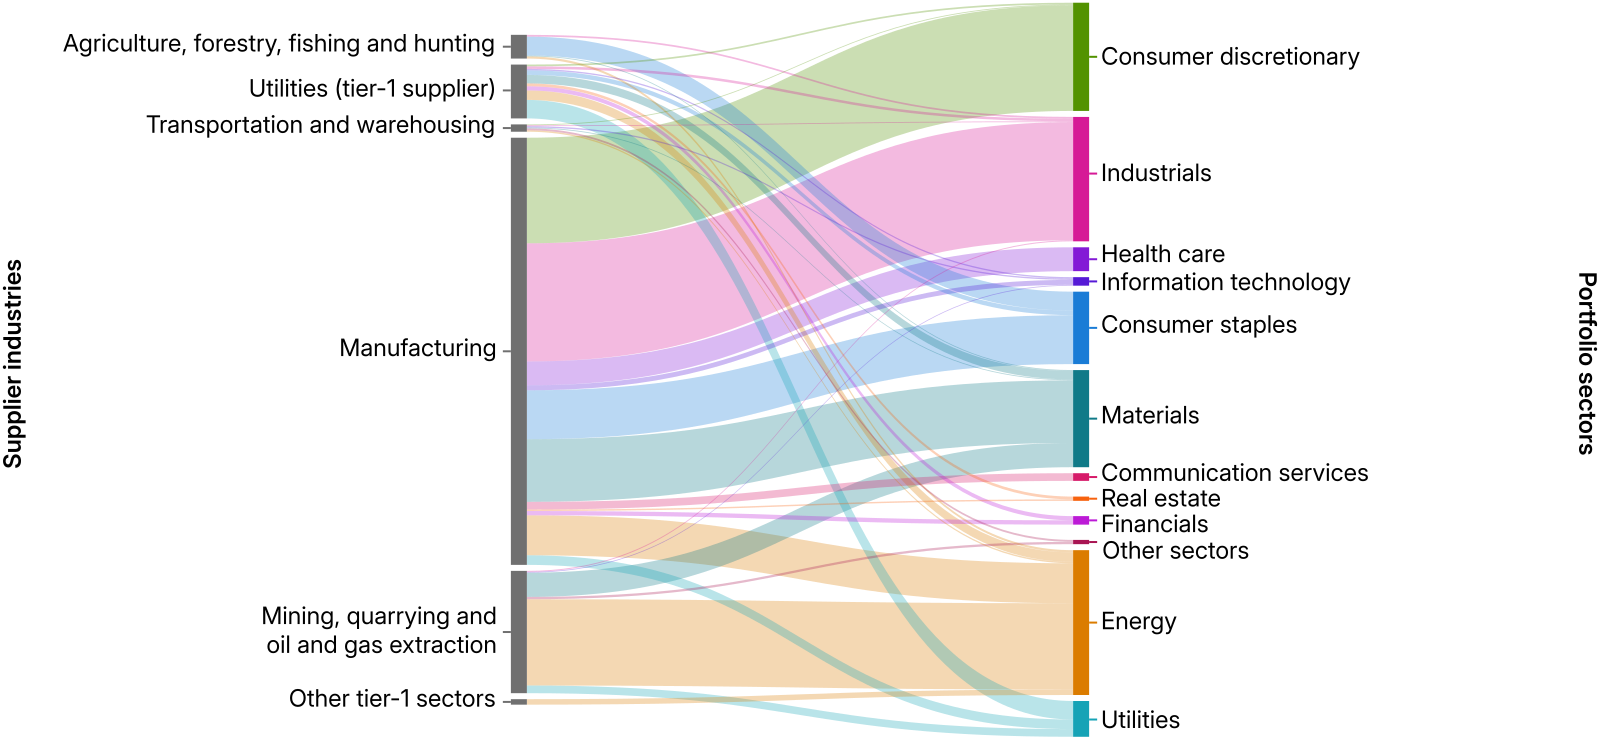
Data as of July 2026. Estimated annual cost increases passed from supplier industries (left) to sectors in the hypothetical portfolio (right). Line thickness indicates the size of the cost increase. Source: MSCI Sustainability & Climate
Your bill is ready to view
In 2026, drought has become an uncomfortably familiar experience and the latest projections suggesting the "Godzilla" El Niño we are currently experiencing will last into 2027, do little to dispel that sentiment.9 Twenty-five years of observed losses give investors reason to look beyond whether water scarcity is financially relevant and identify which holdings face the largest potential costs, where those costs arise and whether suppliers amplify them. Location and business activity help determine who picks up more of the bill — and even portfolios that appear removed from water-scarce regions may carry exposure through their supply chains.

Subscribe todayto have insights delivered to your inbox.
Water Scarcity Already Costs Companies USD 485 Billion a Year
Which companies face the greatest financial risks from water scarcity? New MSCI analysis identifies where losses are concentrated across operations and supply chains.
An Investor's Guide to Nature and Biodiversity Risks and Impacts
What could nature loss mean for your returns? Our new guide can help you assess impacts, manage rising risks and capture opportunities as markets shift toward a nature-positive future.
Nature and Biodiversity
Identify and measure nature- and biodiversity-related risks and impacts.
1 Sarah Kew, Mariam Zachariah, Dominik Schumacher, Svenja Seeber and Martin Hirschi, "Increasingly hot Europe faces more severe droughts and growing challenges for water and land management," World Weather Attribution, July 23, 2026
2 "Latin America Hydropower Drought Risk: What Buyers Face Now," Environment+Energy Leader, May 20, 2026. Marian Chiriac, "Romania Cuts Industrial Output to Ease Power Shortage," Balkan Insight, Aug. 4, 2026.
3 "Record-breaking heat and extreme weather continue," World Meteorological Organization, Aug. 12, 2026.
4 "Billion-Dollar Weather and Climate Disasters," NOAA National Climatic Data Center, 2013. USD 30 billion at the time, equivalent to approximately USD 44.8 billion in 2025 dollars.
5 "Letter from the Chairman of the Board of Executive Directors," BASF Report 2018, Feb. 26, 2019.
6 Jesline Tang and Leah Chen, "China's Power Shortages Disrupt Nonferrous Operations," S&P Global Commodity Insights, Aug. 18, 2022. Reports drought-related hydropower shortages and electricity restrictions affecting aluminum production in Sichuan.
7 GICS is the industry-classification standard jointly developed by MSCI and S&P Dow Jones Indices.
8 This analysis does not yet include investor holdings or lending exposures, which may again change the most relevant hot spots.
9 Juan Hernandez, "Forecasts Have Upgraded Potential 'Super El Niño' to 'Godzilla El Niño,'" The Inertia, March 10, 2026. Nuala Burnett, "What Might a 'Godzilla' El Niño Mean for the UK?" House of Commons Library, Research Briefing CBP-10901, Sept. 4, 2026.
The content of this page is for informational purposes only and is intended for institutional professionals with the analytical resources and tools necessary to interpret any performance information. Nothing herein is intended to recommend any product, tool or service. For all references to laws, rules or regulations, please note that the information is provided “as is” and does not constitute legal advice or any binding interpretation. Any approach to comply with regulatory or policy initiatives should be discussed with your own legal counsel and/or the relevant competent authority, as needed.