
Adaptation Benefits Are Concentrated in a Small Number of Assets
Mentioned in this quick take:
MSCI Physical Risk Solutions | MSCI GeoSpatial Asset Intelligence
A positive economic case for adaptation at the company level does not mean that adaptation is warranted at every exposed asset. Of the roughly 435,000 assets operated by higher-exposure, lower-preparedness (HELP) companies, only 2.2% (9,612 assets) have a positive savings-on-investment (SOI) adaptation opportunity under present-day conditions. The top 1% of assets represent 99% of the modeled benefit.
This concentration suggests that adaptation can be highly targeted. The typical HELP company operates roughly 130 assets, but the median company would need to adapt only six to capture the modeled benefits identified under present-day conditions. Identifying where high exposure and potential losses coincide with cost-effective adaptation may therefore be more important than applying measures broadly across a company’s operating footprint.
Opportunities vary by hazard and geography
The opportunities also show clear hazard and geographic patterns. The analysis currently covers acute — flood, wind/tropical cyclone and wildfire — rather than chronic hazards. Flood accounts for roughly 70% of present-day modeled avoided losses across positive-SOI assets, followed by wind and tropical-cyclone measures at less than 30%, with wildfire contributing a modest share. Geographically, modeled benefits are concentrated in the Americas and Asia-Pacific, reflecting clusters of flood exposure across major economic and industrial regions and wind-related opportunities along tropical-cyclone corridors.
For investors, the concentration of modeled benefits suggests that assessing adaptation at the asset level may help distinguish where resilience spending could have the greatest potential economic benefit.
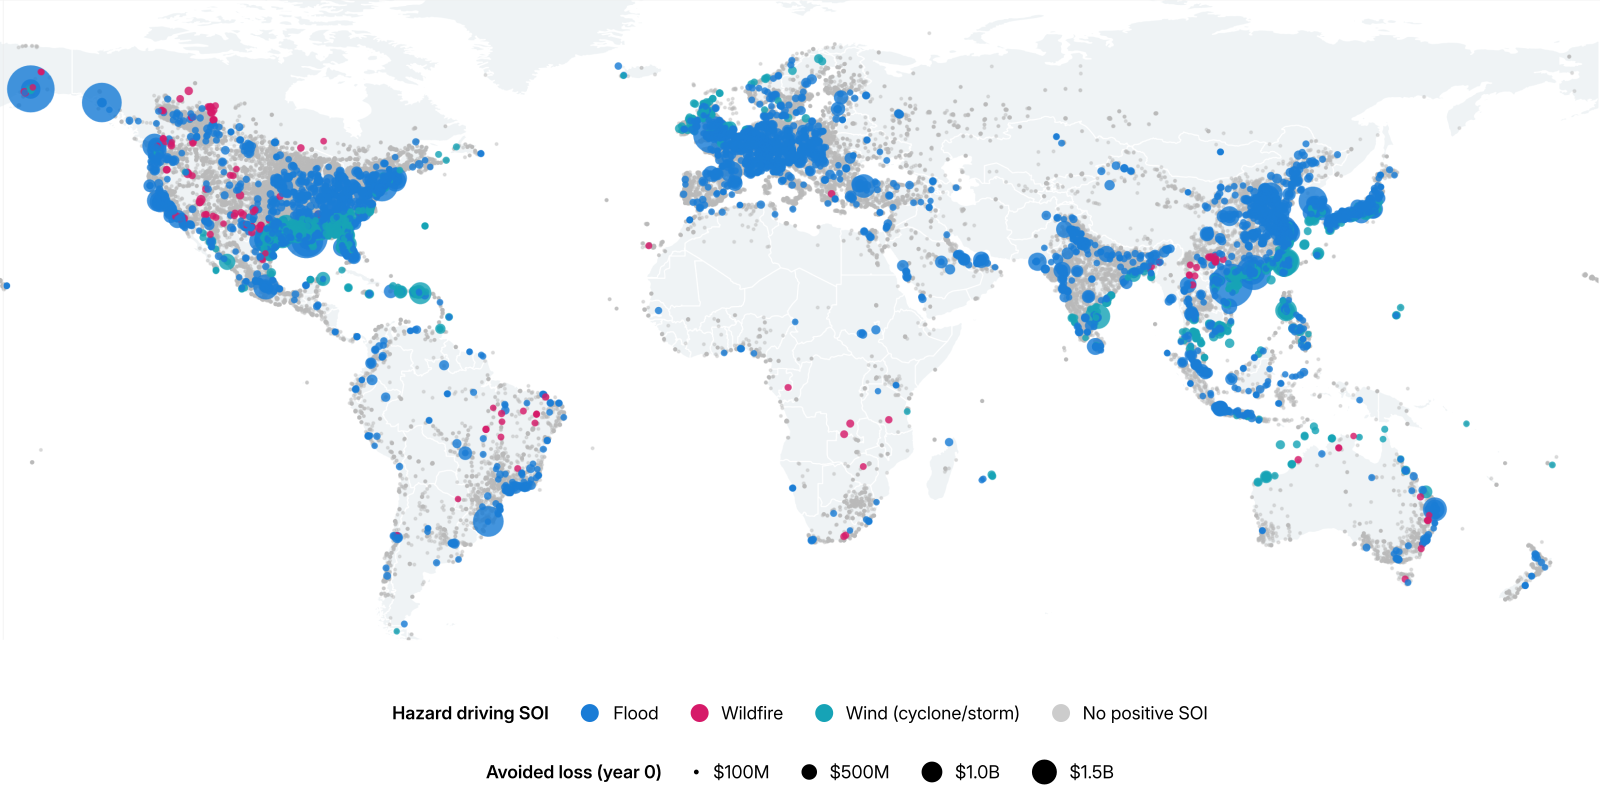
Data as of Aug. 3, 2026. The map shows company assets assessed for own-asset adaptation to flood, wind and wildfire. Colored points identify assets where modeled avoided losses exceed adaptation costs, with color indicating the hazard driving the adaptation benefit and point size representing modeled avoided loss. Grey points indicate assets without a positive modeled adaptation case. The geographic clustering highlights where physical exposure and potential avoided losses create stronger economic incentives for adaptation. Source: MSCI Sustainability & Climate. MSCI Sustainability & Climate products and services are provided by MSCI Solutions LLC in the United States and MSCI Solutions (UK) Limited in the United Kingdom and certain other related entities.




Subscribe todayto have insights delivered to your inbox.
The Price of Not Knowing
Companies often recognized physical climate risk only after a shock. Our analysis shows how asset-level modeling can help investors identify exposure earlier — along with any adaptation opportunities.
GeoSpatial Asset Intelligence
GeoSpatial Asset Intelligence delivers asset-level nature and physical risk data to help investors, banks and insurers identify and manage risk.
First Street is now part of MSCI
We exist to make the connection between climate and financial risk at scale for financial institutions, companies and governments.
The content of this page is for informational purposes only and is intended for institutional professionals with the analytical resources and tools necessary to interpret any performance information. Nothing herein is intended to recommend any product, tool or service. For all references to laws, rules or regulations, please note that the information is provided “as is” and does not constitute legal advice or any binding interpretation. Any approach to comply with regulatory or policy initiatives should be discussed with your own legal counsel and/or the relevant competent authority, as needed.