
Buyout Has Narrowed Its Gap to Public Valuations
Buyout portfolio companies’ EBITDA-multiple discount to MSCI ACWI Index constituents has narrowed sharply from an average of 1.2x in 2015–2019 to an average of just 0.3x in 2022–Q1 2026.1 This valuation shift warrants closer attention from investors amid subdued exit activity and constrained distributions in private equity.
The multiples-gap compression followed a period of extreme divergence in 2020-2021, when ACWI’s multiple rose faster than buyout’s, climbing from 11x to 13x, versus buyout’s modest rise from 10x to 10.6x, widening the discount to 2.4x and as high as 3.7x in Q4 2020. The 2022–Q1 2026 narrowing reflected ACWI’s sharp downward correction alongside buyout’s steady climb, setting up the question of whether this convergence is durable or a function of lagged, smoothed private marks catching up to public markets.
Fundamentals have entered the chat
The narrower buyout-ACWI EBITDA-multiple gap in 2022–Q1 2026 coincided with a shift in annual revenue growth: Buyout’s revenue-growth advantage over ACWI doubled, from 3 percentage points (7% vs 4%) in 2015-2019 to 6 percentage points (11% vs 5%) in 2022–Q1 2026. This advantage has held steadily for four straight years, stronger and longer than any outperformance stretch in 2015-2021. EBITDA margins, meanwhile, moved only modestly for both buyout and ACWI, with little change in the gap between them.
Broader factors, such as investment age, company size, geography and sector, may have also contributed to the median EBITDA-multiple and revenue-growth patterns. For example, the share of buyout portfolio companies in information technology, health care, industrials and consumer discretionary rose from 67% to 77% between Q1 2015 and Q1 2026 — a larger increase than ACWI’s rise from 42% to 47%.2
What closing the gap means for investors
The buyout-ACWI convergence invites a closer look at which force has weighed more heavily on private valuations: improving fundamentals or mechanical lag and smoothing. With exits increasingly leaning on revenue growth, funds unable to sustain it may face valuation pressure or drift into zombie status.
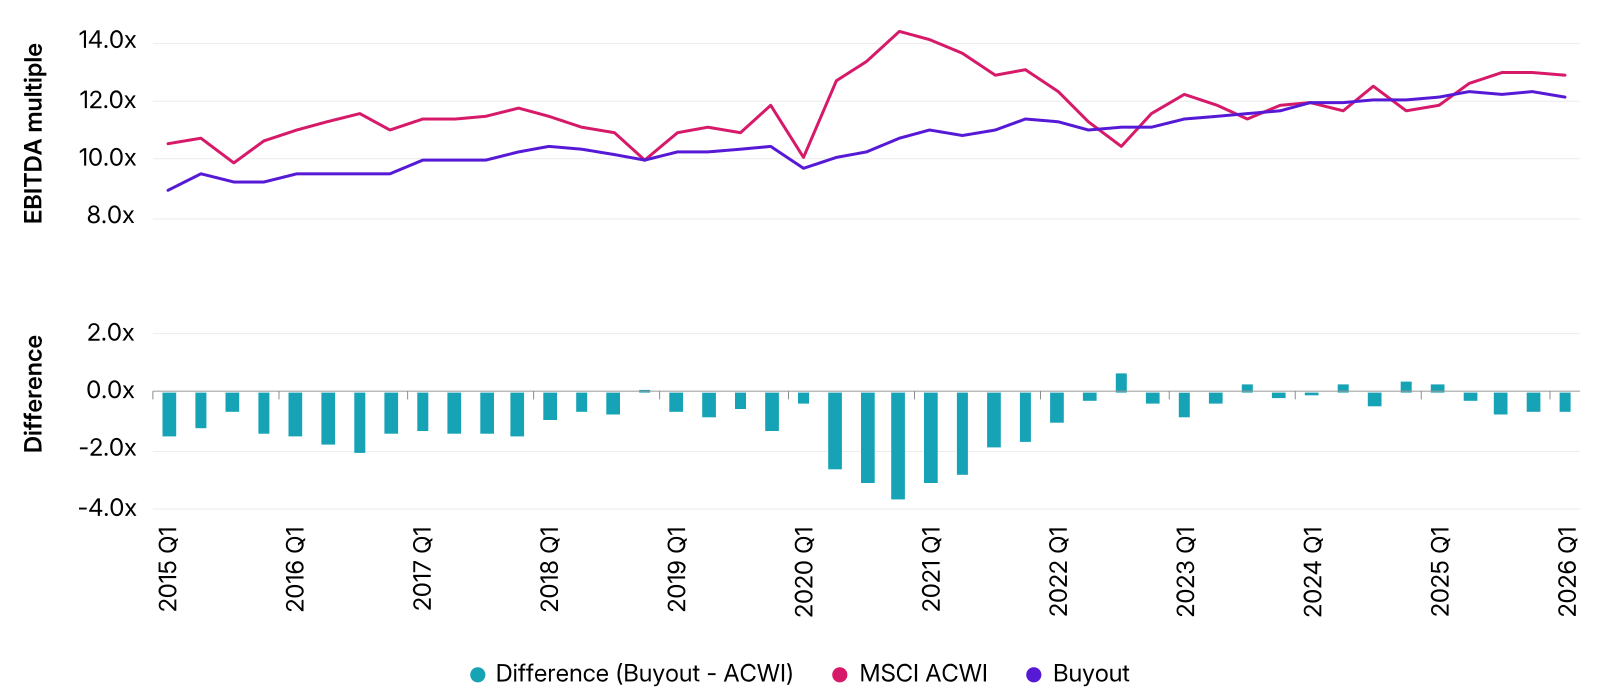
EBITDA multiple is TEV/EBITDA. Lines represent median EBITDA multiples in buyout and MSCI ACWI, by quarter; columns represent the difference between the two. EBITDA is trailing 12-month data. Buyout data as of Q1 2026; MSCI ACWI data as of Aug. 8, 2026. Source: FactSet, MSCI Private Asset and Deal Metrics
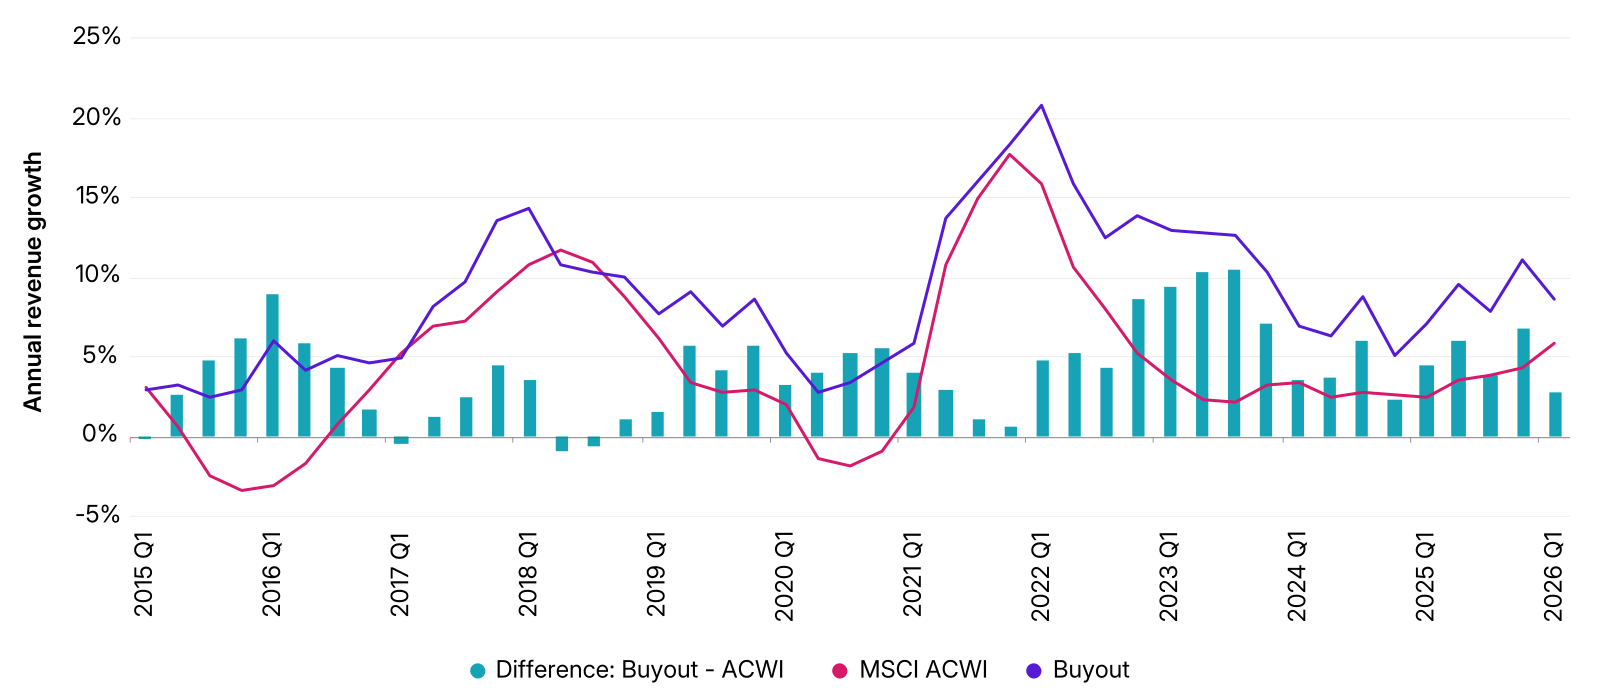
Lines represent median annual revenue growth in buyout and MSCI ACWI, by quarter; columns represent the difference between the two. Buyout data as of Q1 2026; MSCI ACWI data as of Aug. 8, 2026. Source: FactSet, MSCI Private Asset and Deal Metrics


Subscribe todayto have insights delivered to your inbox.
MSCI Private Assets
Achieve greater transparency with our data, indexes and analytics for confident decision-making in private asset investing.
Crossing the Buyout Value Bridge as Valuations Wobble
Buyout value creation has rotated from multiples to fundamentals. Revenue growth, not multiple expansion, anchors exits — raising stakes for liquidity, fundamentals and zombie-fund risk.
Night of the Living Fund: The Rise of Zombie Private Equity
Zombie private-equity funds are carrying unusually high net asset values due to persistently low distribution rates. This trend challenges traditional cash-flow models and raises concerns about liquidity in private-capital portfolios.
1 EBITDA multiples and revenue growth are expressed as medians for each quarter. Figures for multi-year periods (e.g., 2015-2019) are calculated by averaging these quarterly medians across the relevant quarters. For example, 1.2x is the average of the quarterly differences between buyout’s and MSCI ACWI’s median EBITDA multiples over 2015-2019.
2 Share based on count of companies. Global Industry Classification Standard (GICS®) sectors. GICS is the industry-classification standard jointly developed by MSCI and S&P Dow Jones Indices.
The content of this page is for informational purposes only and is intended for institutional professionals with the analytical resources and tools necessary to interpret any performance information. Nothing herein is intended to recommend any product, tool or service. For all references to laws, rules or regulations, please note that the information is provided “as is” and does not constitute legal advice or any binding interpretation. Any approach to comply with regulatory or policy initiatives should be discussed with your own legal counsel and/or the relevant competent authority, as needed.