Private-Credit Funds Eclipsed Private Equity in 2024
Global private-credit funds surpassed private equity in 2024, a third consecutive year that the overall strategy has outperformed equity, as elevated interest rates continued to pass through to lenders.
Private-credit closed-end funds posted a 6.9% annual return, according to the most recent update of the MSCI Private Capital Universe. Private equity was close behind with a 5.6% annual return, and all three subgroups posted positive returns although these lagged the performance seen in listed markets. Venture-capital (VC) funds, for instance, posted a 5.1% return, far behind the MSCI World Information Technology Index. Exit opportunities for VC funds remain scarce and those funds' returns are influenced by smoothed valuations and the delayed recognition of write-downs.
On a quarterly basis in Q4 2024, global private-equity funds ended the year at the top. It was a mixed story in private credit as the relative strength of the U.S. dollar dragged on the USD returns of non-U.S. funds — a factor most pronounced in senior debt. In private-real-asset funds, all subgroups posted negative quarterly returns. Real estate was down 2.2%, reverting to the negative performance seen since mid-2022.
Distributions stuck below prior norms
On the distribution front, buyout funds distributed more capital than VC in the fourth quarter, but rates for both remained well below their five-year averages before the COVID-19 pandemic. The slow pace of distributions remains a concern for limited partners in private-equity funds as capital remains stuck and they are not able to redeploy it into new investments.
Credit on top for annual return
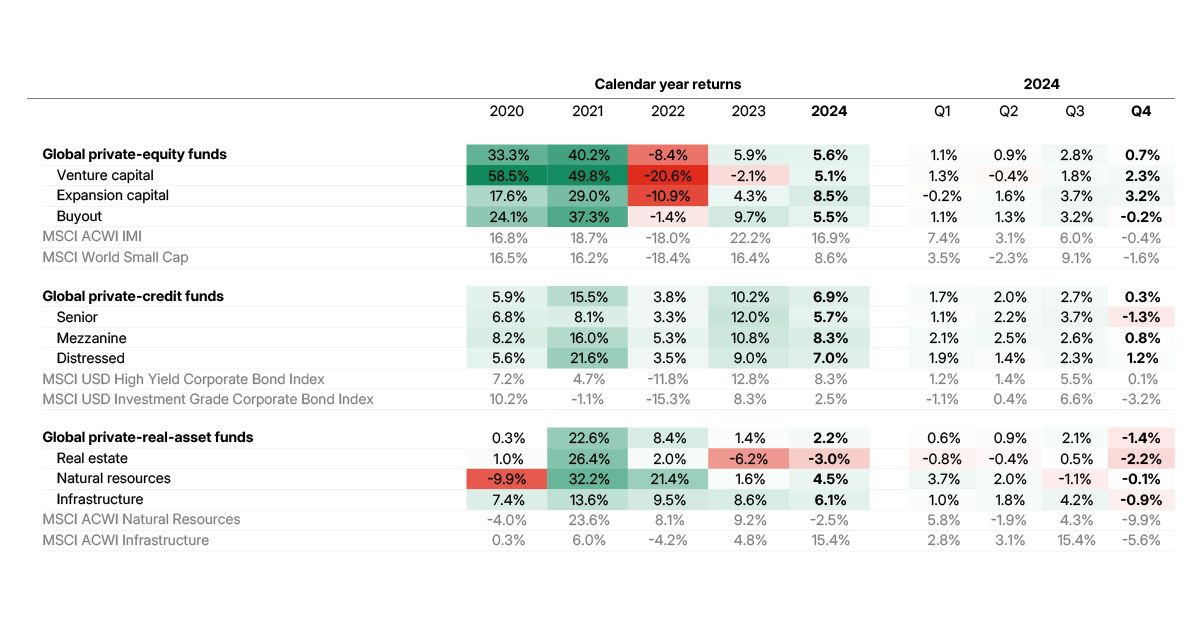
Quarterly returns are calculated in USD using the Modified Dietz method and are not annualized. Calendar-year returns represent compounded quarterly returns. Data as of Q4 2024 from the MSCI Private Capital Universe.
All quiet on the exit front
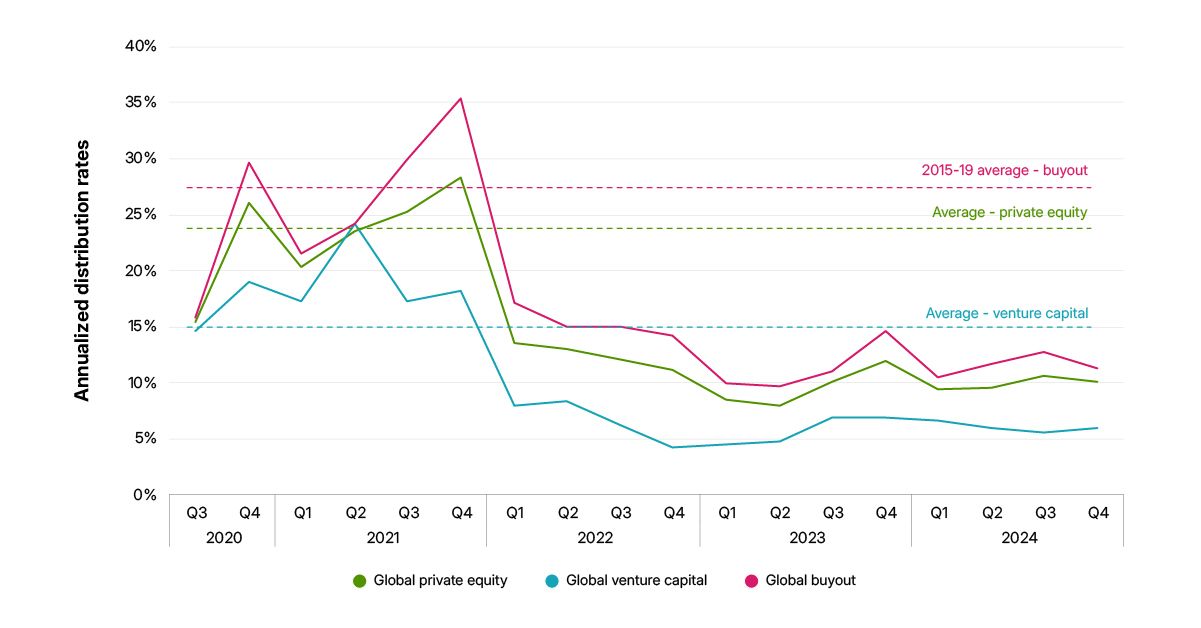
Distribution rates are calculated as capital distributed to limited partners in each period divided by the starting valuation and are annualized. All figures are calculated in USD. Data as of Q4 2024 from the MSCI Private Capital Universe.


Subscribe todayto have insights delivered to your inbox.
Private-Equity Distributions in Limbo: How Low Can They Go?
Investors in private-equity funds already faced depressed distribution rates before the recent public-market turmoil. We chart how public-market returns and downturns in buyout and venture-capital distributions have played out historically.
An Inconvenient Call: Capital Calls During a Crisis
Even amid a market downturn, investors in private-capital funds should be aware of the risk of a surge in capital calls. We chart the trends across asset classes at the onset of the COVID-19 crisis.
The content of this page is for informational purposes only and is intended for institutional professionals with the analytical resources and tools necessary to interpret any performance information. Nothing herein is intended to recommend any product, tool or service. For all references to laws, rules or regulations, please note that the information is provided “as is” and does not constitute legal advice or any binding interpretation. Any approach to comply with regulatory or policy initiatives should be discussed with your own legal counsel and/or the relevant competent authority, as needed.