
Scenario Analysis: The AI Supply Chain Under Stress
Geographic diversification in global equity portfolios may hide a common dependence on U.S. hyperscalers’ AI capital spending. Asian semiconductor companies and European chip-equipment firms have created a cross-border concentration risk: A slowdown in that spending could spread from U.S. platforms to memory producers, foundries and equipment suppliers. We use the MSCI Multi-Asset Class Factor Model (MAC) to construct two AI scenarios.
AI broadens, or the supply chain reprices
In the scenario of “broadening AI participation,” gains diffuse from megacap incumbents to adopters, as AI moves from build to deploy. Index concentration unwinds through return dispersion, rather than through a correction, with adopters capturing the incremental return that leaders no longer monopolize; concentration decreases because the winners broaden.
In the downside scenario, “AI supply-chain repricing,” hyperscaler capex disappointment triggers a repricing that travels the concentrated AI hardware supply chain rather than staying inside U.S. platforms. Korean memory, Taiwanese foundries and Europe’s chip equipment absorb the concentrated hit. Credit amplifies the equity move. Concentration decreases because the leaders fall.
Duration diversifies where geography cannot
To assess the scenarios’ impact, we used MSCI’s predictive stress-testing framework and applied the shocks from the table below to a hypothetical multi-asset-class portfolio consisting of global equities, U.S. bonds, private equity, private credit and real estate.1
Under AI supply-chain repricing, global equities lose 13%, with industry effects, led by semiconductors, adding materially to the broader market decline. Credit spreads widen, but the Treasury rally cushions the impact, leaving the composite portfolio down 6%. Under broadening AI participation, global equities gain 7%, with machinery making the largest positive industry contribution, capturing the industrial-adopter side of the broadening. Higher Treasury yields weigh modestly on duration, while the composite portfolio gains 3%.
Geographic diversification may hide a common AI-capex dependence. Duration, not geography, could cushion an equity-led sell-off. Multi-asset-class portfolios that appear diversified by country may still warrant a stress test on their AI-capex exposure.
The author thanks Zsofia Dabi for her contributions to this quick take.
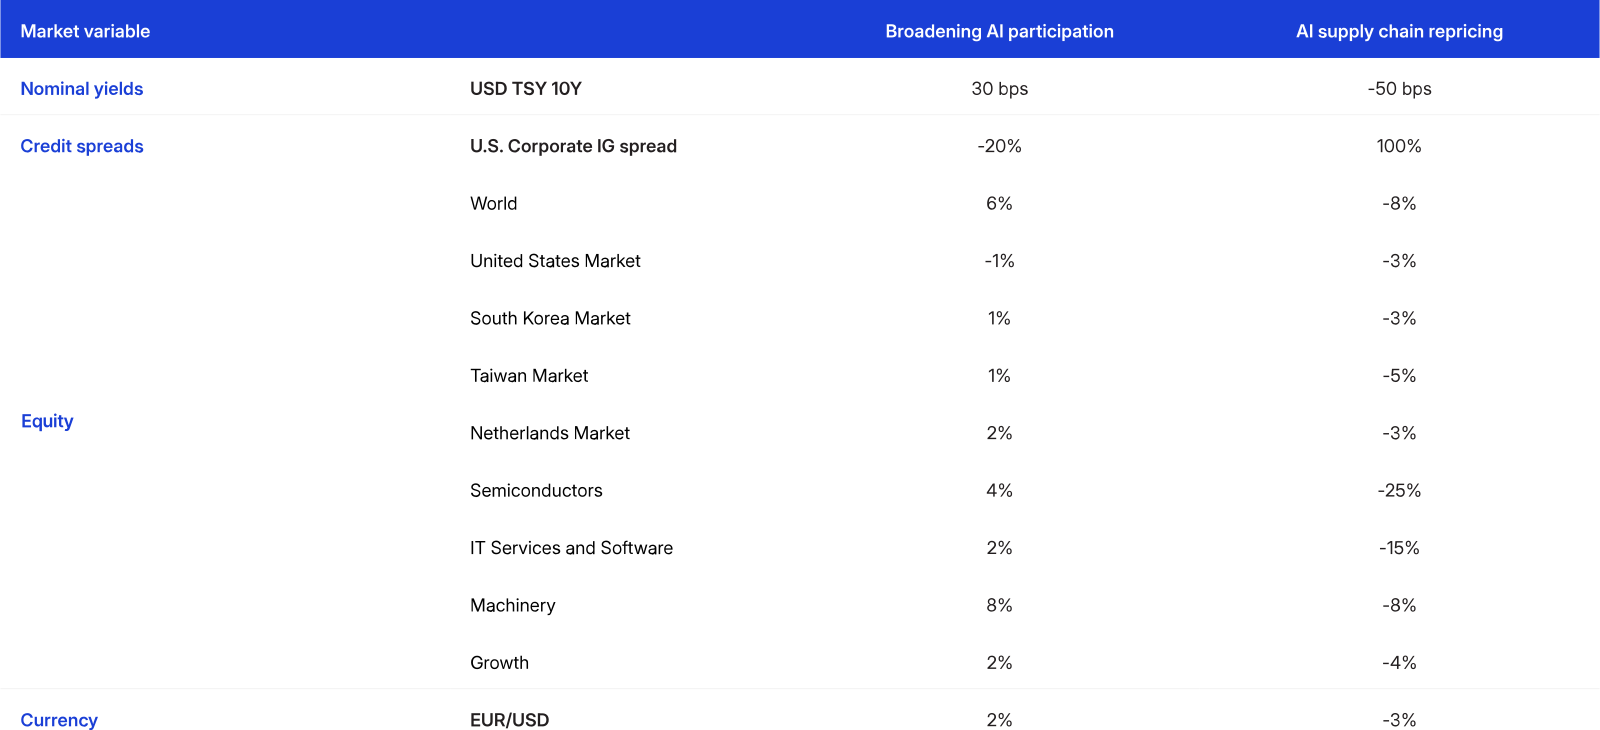
Assumptions about MAC.S Global Total Market Equity Model (GEMLT) risk-factor shocks are informed by analysis of historical data and judgment. Each equity market’s total impact combines the world-factor, industry and style shocks weighted by the market’s exposures to these factors.3 This analysis is not a forecast, but a hypothetical narrative of how the scenario could affect multi-asset-class portfolios.
Portfolio impact in USD of the scenarios based on market data as of July 24, 2026. Source: S&P Global Market Intelligence, MSCI

Subscribe todayto have insights delivered to your inbox.
Investment Trends in Focus: Midyear Update 2026
AI, not geopolitics, drove markets in 2026’s first half. But the gains were narrow, and the equity risk premium has hit its lowest point since the dot-com era.
Scenario Analysis: Tracing Credit Stress Across Private and Public Markets
Two stagflationary scenarios — private-credit contagion and hyperscaler repricing — each produce ~11% portfolio losses but through different channels. Identifying which dominates matters more than the headline loss.
Multi-Asset Class Factor Model
An asset allocation model that informs systematic strategies with consistency across asset classes and enables you to identify key risk and return drivers.
1 The results are generated by using model correlations to propagate shocks to the portfolios, using MSCI's BarraOne®. MSCI clients can download the correlated BarraOne stress test and RiskMetrics® RiskManager® stress test. Note that the above stress-test results capture the effect of repricing the assets, not the income component. Treasury inflation-protected securities (TIPS) are represented by the iBoxx TIPS Inflation-Linked Index provided by S&P Dow Jones Indices. U.S. Treasurys, equities and corporate bonds are represented by MSCI indexes. Private equity and private credit are represented by model portfolios. U.S. real estate is represented by the MSCI/PREA U.S. AFOE Quarterly Property Fund Index. The composite portfolio is 35% global public equities, 24% U.S. Treasurys, 2% TIPS, 12% U.S. investment-grade bonds, 2% U.S. high-yield bonds, 10% U.S. real estate and 15% global private assets (13% private equity, 2% private credit).
2 Machinery proxies for broad industrial AI adoption: It is positively correlated with the adopter complex (building products/construction and engineering 0.72, chemicals 0.50) and −0.55 correlated with IT services and software, capturing the adopter lift and software lag in one shock. Its gain during the first week of the Jan. 27, 2026, software sell-off is consistent with this rotation.
3 In a correlated stress test, both the direct shocks shown above and the shocks that propagate through the MAC.S GEMLT factor correlation matrix contribute to the total impact on any market. Each market's total impact reflects its exposures across all factors — the world factor, industry factors, style factors and its own country factor — with the country-specific shock adding concentrated dispersion on top of the larger moves that propagate through industry and world factor exposures. For example, the total profit-and-loss impact on Korean equities in this scenario is -52%.
The content of this page is for informational purposes only and is intended for institutional professionals with the analytical resources and tools necessary to interpret any performance information. Nothing herein is intended to recommend any product, tool or service. For all references to laws, rules or regulations, please note that the information is provided “as is” and does not constitute legal advice or any binding interpretation. Any approach to comply with regulatory or policy initiatives should be discussed with your own legal counsel and/or the relevant competent authority, as needed.