Navigation

  • Skip to Content
  • Client Log In
  • Investor relations
  • Subscribe
  • Contact us
  • Careers
  • Language
  • Back
  • MSCI Client Support Site
  • Barra PortfolioManager
  • BarraOne
  • MSCI ESG Manager
  • MSCI ESG Direct
  • Global Index Lens
  • MSCI Real Assets Analytics Portal
  • RiskManager 3
  • CreditManager
  • RiskManager 4
  • Index Monitor
  • MSCI Datscha
  • MSCI Real Capital Analytics
  • Back
  • English
  • Chinese
Navigation

Navigation Menu

  • Our Clients
    • Back
    • Asset Managers
      • Back
      • Asset Managers
      • Featured

        Insights on MSCI One
    • Asset Owners
      • Back
      • Asset Owners
      • Featured

        Institutional Client Designed Indexes (iCDIs)
    • Banks
      • Back
      • Banks
      • Featured

        Total Portfolio Footprinting
    • Corporates
      • Back
      • Corporates
      • Featured

        ESG Trends to Watch
    • Insurance Companies
      • Back
      • Insurance Companies
      • Featured

        Total Portfolio Footprinting
    • Wealth Managers
      • Back
      • Wealth Managers
      • Featured

        Visualizing Investment Data
  • Our Solutions
    • Back
    • Analytics
      • Back
      • Analytics
      • Crowding Solutions
      • FactorLab
      • Fixed Income Analytics
      • Managed Solutions
      • Multi-asset Class Factor Models
      • Portfolio Management
      • Regulatory Solutions
      • Risk Insights
    • Climate Investing
      • Back
      • Climate Investing
      • Biodiversity
      • Climate and Net-Zero Solutions
        • Back
        • Climate and Net-Zero Solutions
        • Featured

          Implied Temperature Rise
      • Climate Indexes
      • Climate Lab Enterprise
      • Featured

        Net-Zero Tracker
      • Real Estate Climate Solutions
    • ESG Investing
      • Back
      • ESG Investing
      • Featured

        Trends 2023
      • ESG Fund Ratings and Climate Search Tool
        • Back
        • ESG Fund Ratings and Climate Search Tool
        • Featured

          ESG and Climate Funds in Focus
      • ESG Indexes
        • Back
        • ESG Indexes
        • Featured

          Role of Capital in the Net-Zero Revolution
      • ESG Ratings
        • Back
        • ESG Ratings
        • Featured

          What is ESG
      • Impact Solutions
        • Back
        • Impact Solutions
        • Featured

          Role of Capital in the Net-Zero Revolution
      • Sustainable Finance Solutions
        • Back
        • Sustainable Finance Solutions
        • Featured

          Role of Capital in the Net-Zero Revolution
    • Factor Investing
      • Back
      • Factor Investing
      • Featured

        MSCI Japan Equity Factor Model
      • Equity Factor Models
      • FaCS
      • Factor Indexes
    • Indexes
      • Back
      • Indexes
      • End of Day Index Data Search
      • Factsheets
      • Index Methodology
      • Index Profiles
      • Index Regulation
      • Index Resources
      • Real-time Index Data Search
      • Thematic Investing
        • Back
        • Thematic Investing
        • Featured

          Thematic Exposure Standard
    • Real Assets
      • Back
      • Real Assets
      • Featured

        2023 Trends to Watch in Real Assets
      • Datscha
      • Enterprise Analytics
      • Global Intel
      • INCANS
      • Private Real Assets Indexes
      • Real Capital Analytics
  • Research & Insights
    • Back
    • Featured

      Trends 2023
    • Research & Insights
      • Back
      • Research & Insights
      • Climate
      • ESG
      • Equities
      • Factor Investing
      • Fixed Income
      • Multi-Asset Class
      • Real Estate
    • Events
      • Back
      • Events
      • Featured

        Capital for Climate Action Conference
      • On Demand
      • Webinars
  • Technology
    • Back
    • Data Explorer
    • Developer Community
    • Technology and Data
  • Who We Are
    • Back
    • About Us
      • Back
      • About Us
      • Featured

        2022 Annual Report
    • Corporate Responsibility
      • Back
      • Corporate Responsibility
      • Enabling Sustainable Investing
      • Environmental Sustainability
      • Governance Practices
      • Social Practices
      • Sustainability Reports and Policies
    • Diversity, Equity and Inclusion
    • Media Room
    • Our Leadership
      • Back
      • Our Leadership
      • Featured

        Henry A. Fernandez
    • Recognition

Main Search

Most visitors searched for:
ACWI Research ESG Factor Investment Insights Gallery Asset Owners
Might interest you:
  • Client Log In
  • Investor relations
  • Subscribe
  • Contact us
  • Careers
  • Language
  • Back
  • MSCI Client Support Site
  • Barra PortfolioManager
  • BarraOne
  • MSCI ESG Manager
  • MSCI ESG Direct
  • Global Index Lens
  • MSCI Real Assets Analytics Portal
  • RiskManager 3
  • CreditManager
  • RiskManager 4
  • Index Monitor
  • MSCI Datscha
  • MSCI Real Capital Analytics
  • Back
  • English
  • Chinese
Index Options Indicated Negative Market Sentiment

Extended Viewer


Index Options Indicated Negative Market Sentiment


Dinank Chitkara and Hitendra Varsani
May 25, 2022

In the face of continued global equity-market volatility, we turn to the listed-options market to gauge the perception of market risk over the coming months for EAFE, emerging markets (EM) and the U.S.1.

The four options-based indicators we analyzed showed investors were concerned about the trajectory of equity markets.

  1. Heightened levels of implied volatility

    Three-month implied volatility across regions remained elevated, with levels in the top decile, 91st percentile, for EAFE and the U.S., and around the 83rd percentile for EM, based on 5-years of history.2 For the U.S., the current levels stood at 88th percentile based on data since January 2000. (See chart one.)

  2. Steep implied-volatility skew: higher premiums for puts vs. calls

    We observed rising skew across regions with heightened negative sentiment for EM relative to the U.S. and EAFE. Skew stood at 14% (93nd percentile) for EM; the U.S. and EAFE stood at 11% and 9% respectively (62nd percentile for the U.S. and 76th percentile for EAFE). (See chart two.)

  3. Inverted-term structure: Short-dated volatility was higher than longer dated volatility.

    The term structure calculated using 91- to 365-day implied-volatility ratio of at-the-money (ATM) options remained inverted (ratio above 1), indicating higher short-term vs. long-term volatility. (See chart three.)

  4. High CBOE Total Put/Call Ratio: Put volumes outpaced call volumes.

    A high CBOE Total Put/Call Ratio (calculated using index and equity options) suggests bearish sentiment. The measure stood at 1.1 based on a 10-day moving average, as of May 20, 2022. Over the last 10 years, the ratio has risen above this level only four times: March 2020, December 2018, November 2016 and September 2015.


Average implied volatility

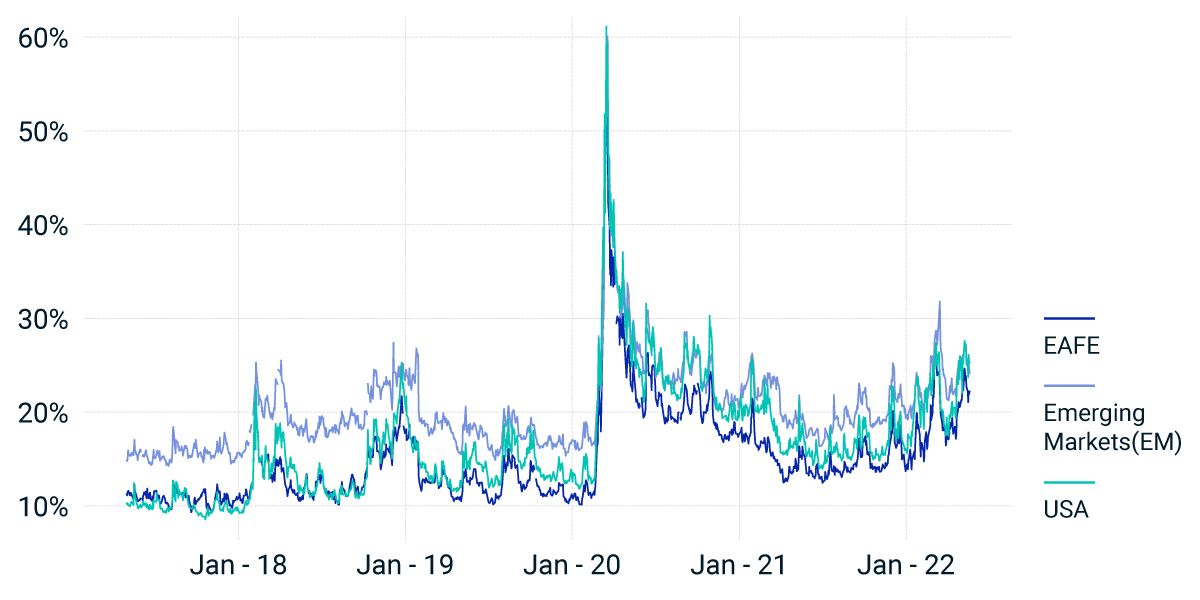
Implied volatility is based on the average implied volatility of 91-day ATM call and put options from May 1, 2017 to May 20, 2022. Source: Optionmetrics.

Implied volatility skew

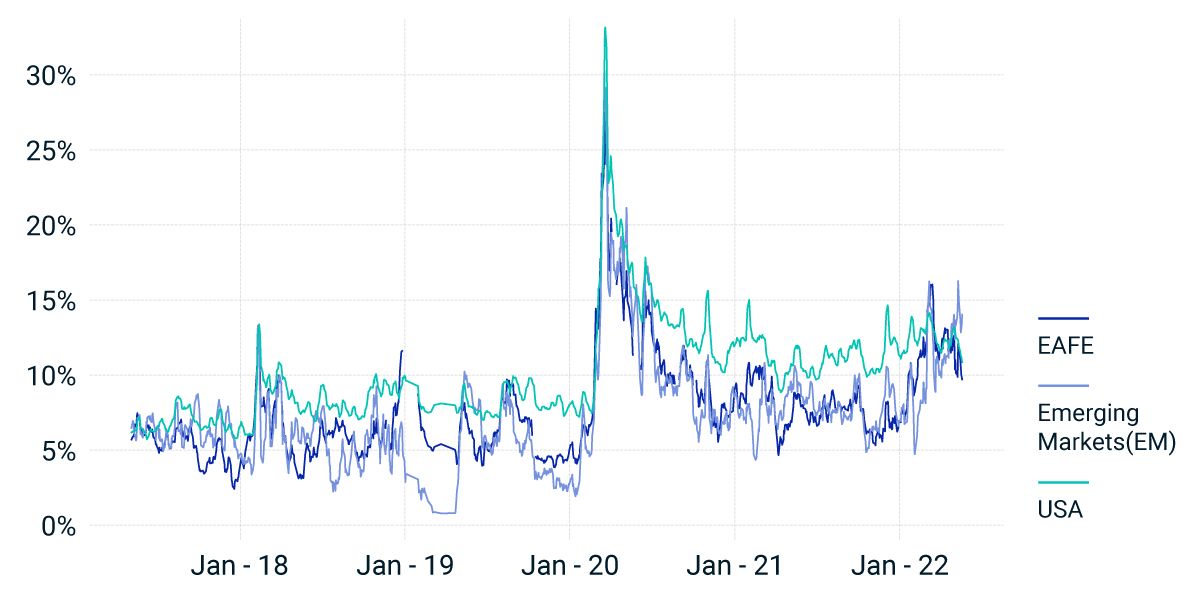
Implied-volatility skew is calculated using the five-day moving average of the put-call implied-volatility spread of the 91-day 20-delta strikes, from May 1, 2017, to May, 20, 2022. Source: OptionMetrics

Volatility term structure

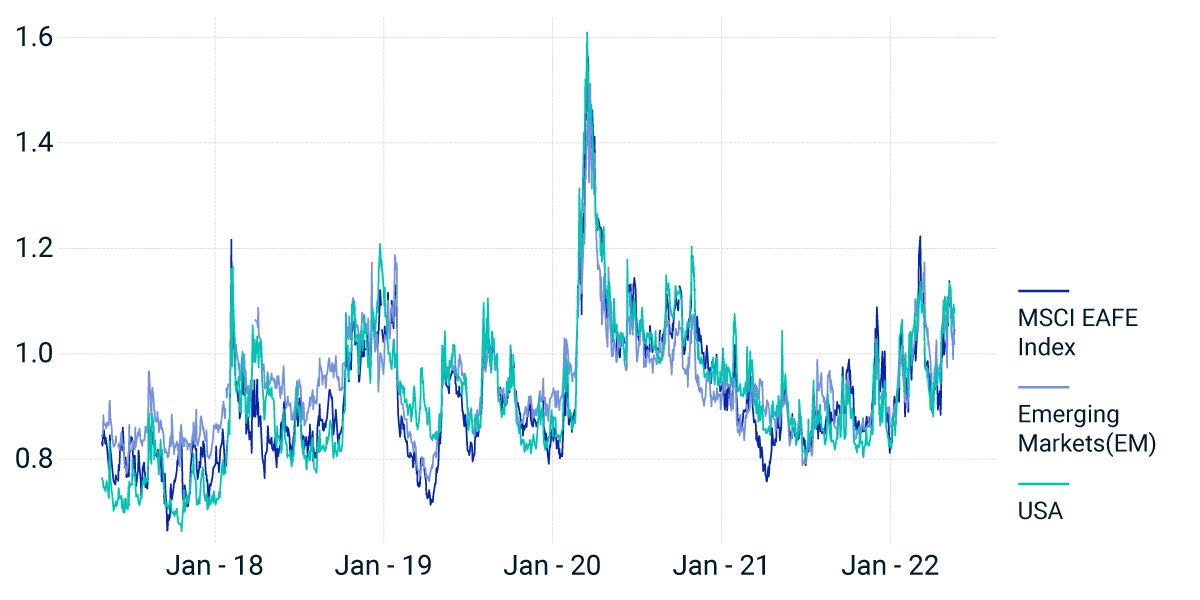
Term Structure is calculated using 91-day to 365-day implied volatility ratio of ATM options, from May 1, 2017, to May 20, 2022. Source: OptionMetrics


1 Options linked to the MSCI EAFE, MSCI Emerging Market and S&P 500 Indexes have been used for the EAFE, EM and U.S. implied volatility calculations, respectively.

2 Percentiles calculated based on data since May 1, 2017.


Related Content

Evaluating Options in Different Macro and Volatility Regimes

Over the past few months, developed- and emerging-market economies have witnessed a rise in inflation and slower growth.

Read More

Markets Indicated Higher-than-Usual Downside Risk for EAFE and EM

Using option-implied-volatility skew — a measure often used to gauge downside vs. upside risk — we have seen a substantial increase in EAFE and EM index skew since the start of the war.

Explore More

ESG and Climate Derivatives in Equity Exposure Management

Most efforts to manage climate and ESG portfolio risks have involved reducing holdings of stocks negatively exposed to these risks, and increasing those that are positively exposed.

Learn More

msci logo
  • Locations
  • Legal
  • Modern Slavery Statement
  • Privacy notice
  • Index regulation
  • Site map
  • Cookies
  • Use of ISO standards
Subscribe Contact us
© 2023 MSCI Inc. All rights reserved

UtmAnalytics