
Markets in Focus: A Crowded Trade Unwinds, but the AI Growth Story Does Not
- The five-week sell-off through July 28 hit AI's physical infrastructure hardest — hardware, data centers and energy — the segments that led the multiyear rally. By contrast, AI application-layer components gained ground.
- For institutional investors, the correction wasn't a capex red flag: Hardware and data-center infrastructure are growing sales faster than they're spending.
- Going into the correction, AI's physical infrastructure was trading on book value, not earnings — a valuation unwind, not a verdict on AI growth. Investors could assess AI exposure by value-chain layer, not as one trade.
During the five weeks ending July 28, AI-linked equities surrendered a meaningful slice of their multiyear gains. Is the market finally reassessing the AI investment cycle? Our evidence points more strongly to a crowded AI trade unwind instead. The correction has been concentrated in specific parts of the AI ecosystem, with factor exposures, fundamentals and valuations all pointing to such a reset rather than a broad loss of confidence in the AI growth story.
Parts of the AI value chain that led the rally over the past few years and carried the highest beta and momentum exposures have experienced the sharpest declines. Several application-layer components, by contrast, generated positive returns over the same period. Rather than a broad reassessment of AI fundamentals, the sell-off appears consistent with a reversal in positioning.
Leadership has reversed across the AI value chainThe recent reversal has been highly concentrated. To examine why, we use the MSCI AI value-chain framework, which organizes AI-related business activity into three layers and 10 underlying components.1 The newly launched MSCI ACWI IMITM AI Value Chain Indexes track each layer and component separately, allowing investors to distinguish between very different sources of AI exposure. Physical and digital infrastructure drove most of the value chain's rerating since 2022, substantially outperforming the applications layer. Those same leaders have now experienced the largest drawdowns.
Hardware gained roughly 106% this year through June 22 before falling around 20% over the subsequent five weeks. Data-center infrastructure rose approximately 92% before giving back about 15%. By contrast, software applications, which had lagged heading into the correction, gained roughly 11% over the same period.
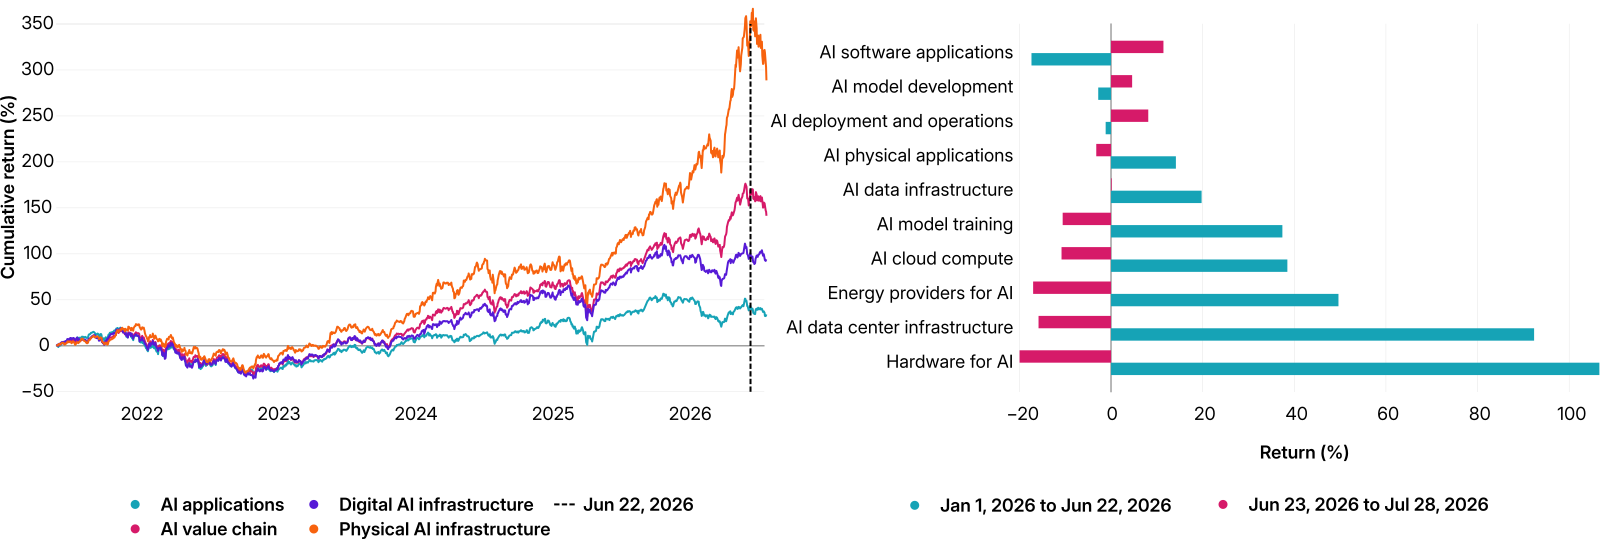
Gross returns in USD based on MSCI ACWI IMITM AI Value Chain Indexes.
Beta, momentum and residual-volatility factors within the MSCI Global Equity Factor Trading Model climbed together through the first half of the year and accelerated into the June peak: the signature of a crowded, systematic trade. As of the end of June, the beta-factor crowding z-score stood at 1.5 standard deviations. That is likely why the reversal moved fast and wide rather than staying contained to a few names.
Investment quality, which includes capex growth as one of the measures, remained largely unchanged despite higher earnings yields following the sell-off, however. Had investors been reassessing balance-sheet strength or financing risk, quality exposures would likely have deteriorated more materially. Instead, the factor profile is more consistent with a valuation and positioning unwind than a broad reassessment of fundamentals. Similar patterns emerged across the U.S., Korea and Taiwan equity risk models, suggesting this has been a global repositioning rather than a country-specific event.2
The speed of the reversal was reflected beyond index performance. Several hedge funds with concentrated AI-related exposures reported sharp drawdowns as crowded positions unwound and leverage was reduced, illustrating how positioning can amplify market moves even when the underlying fundamental narrative remains largely unchanged.3
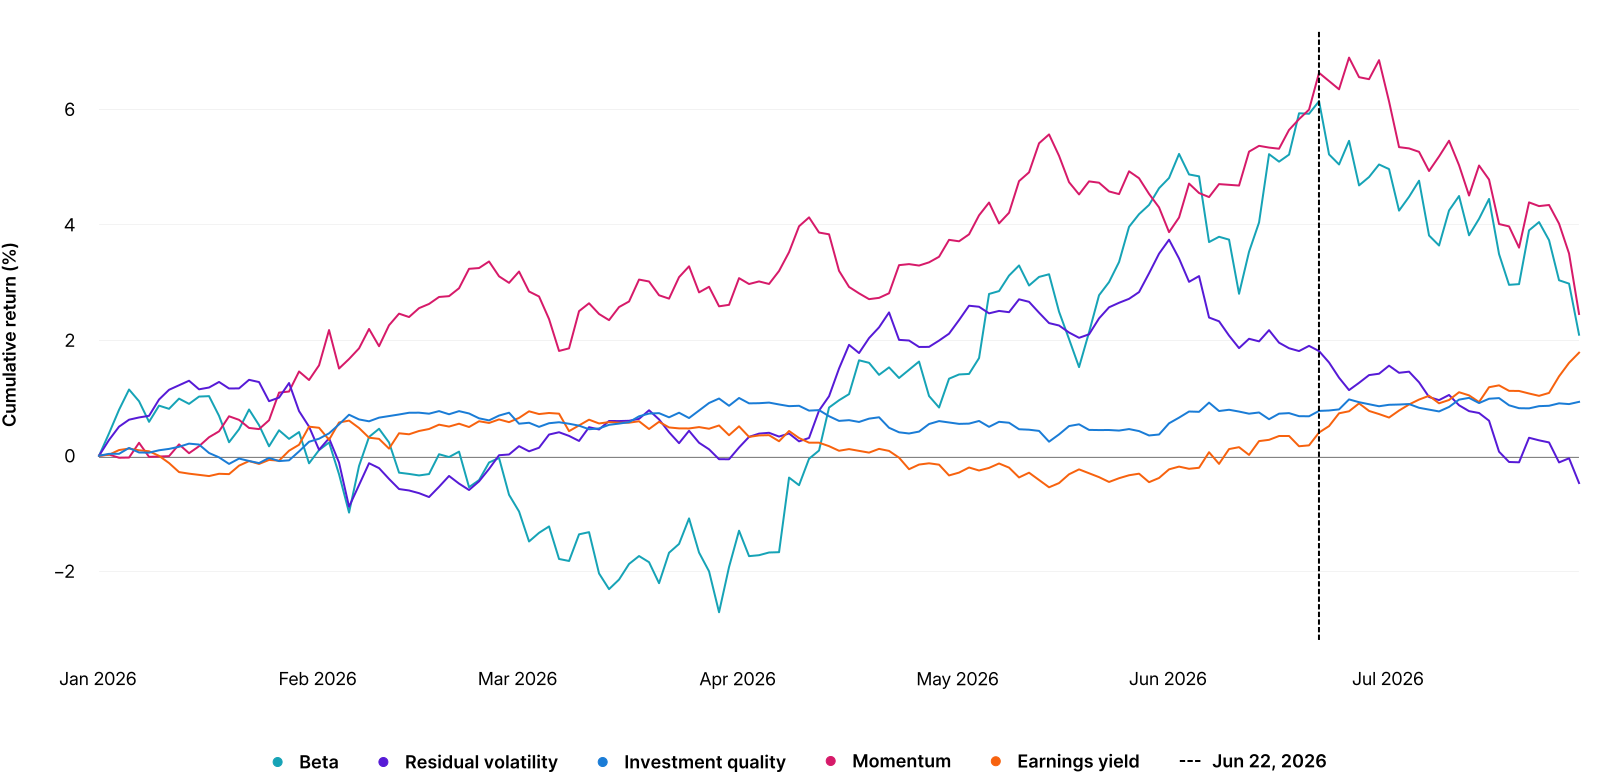
Data from Dec. 31, 2025, to July 28, 2026. Select style factors from MSCI Global Equity Factor Trading Model (EFMGEMTR)
Beta and residual volatility were high in almost every AI component, but momentum is what separated the winners from the losers in the sell-off. Hardware, data-center infrastructure and energy providers were the only components carrying positive momentum exposure. The digital and applications layers were flat or negative, which cushioned their decline as momentum sold off sharply.
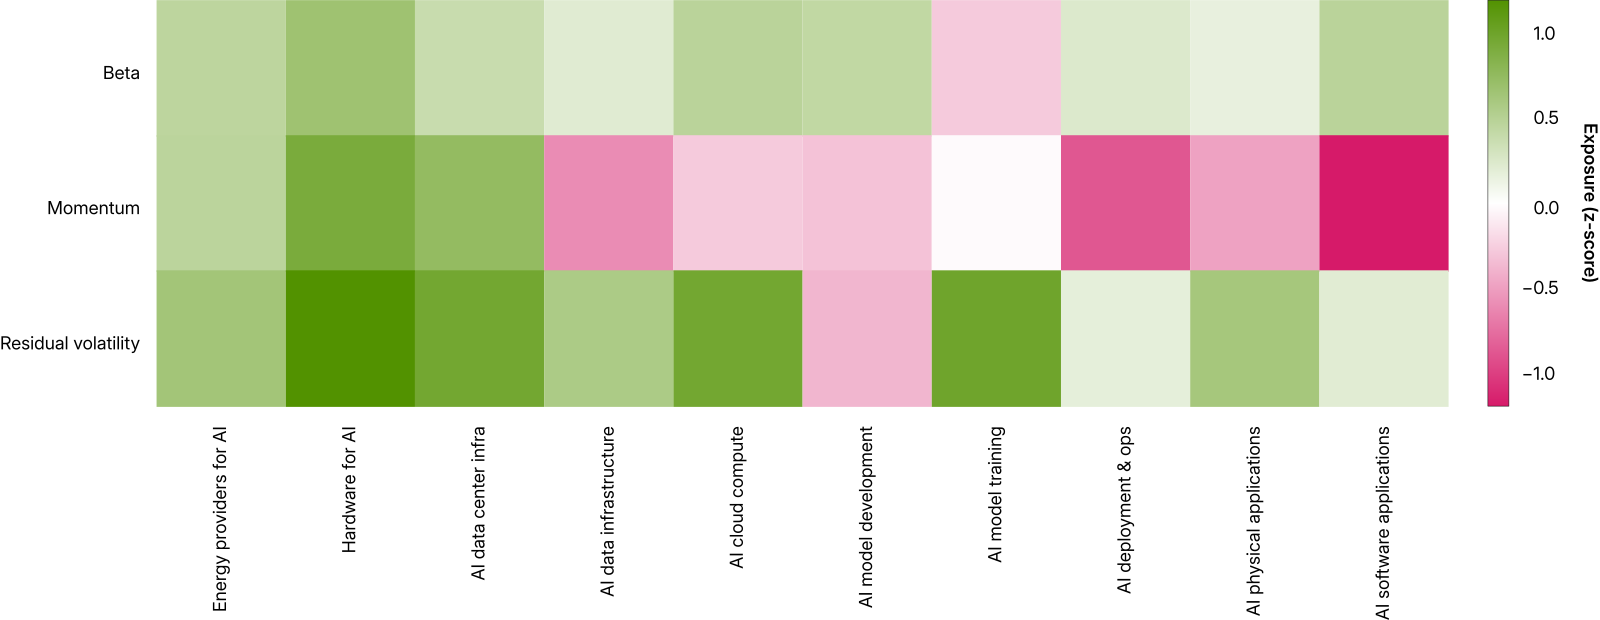
Data as of June 22, 2026. Factor exposures using MSCI global equity risk model (EFMGEMTR).
Capital expenditure has become the dominant explanation for AI sell-offs, but the underlying fundamentals tell a more nuanced story. Cloud compute, which declined, is the one component where capex growth has clearly outpaced revenue growth.
The hardest-hit segments, however, exhibit the opposite dynamic. Hardware recorded sales growth of roughly 35% against capex growth of approximately 13%, while data-center infrastructure generated about 30% sales growth with only 3% capex growth.
These segments' disproportionate declines instead point to positioning, not deteriorating fundamentals, as the dominant driver.
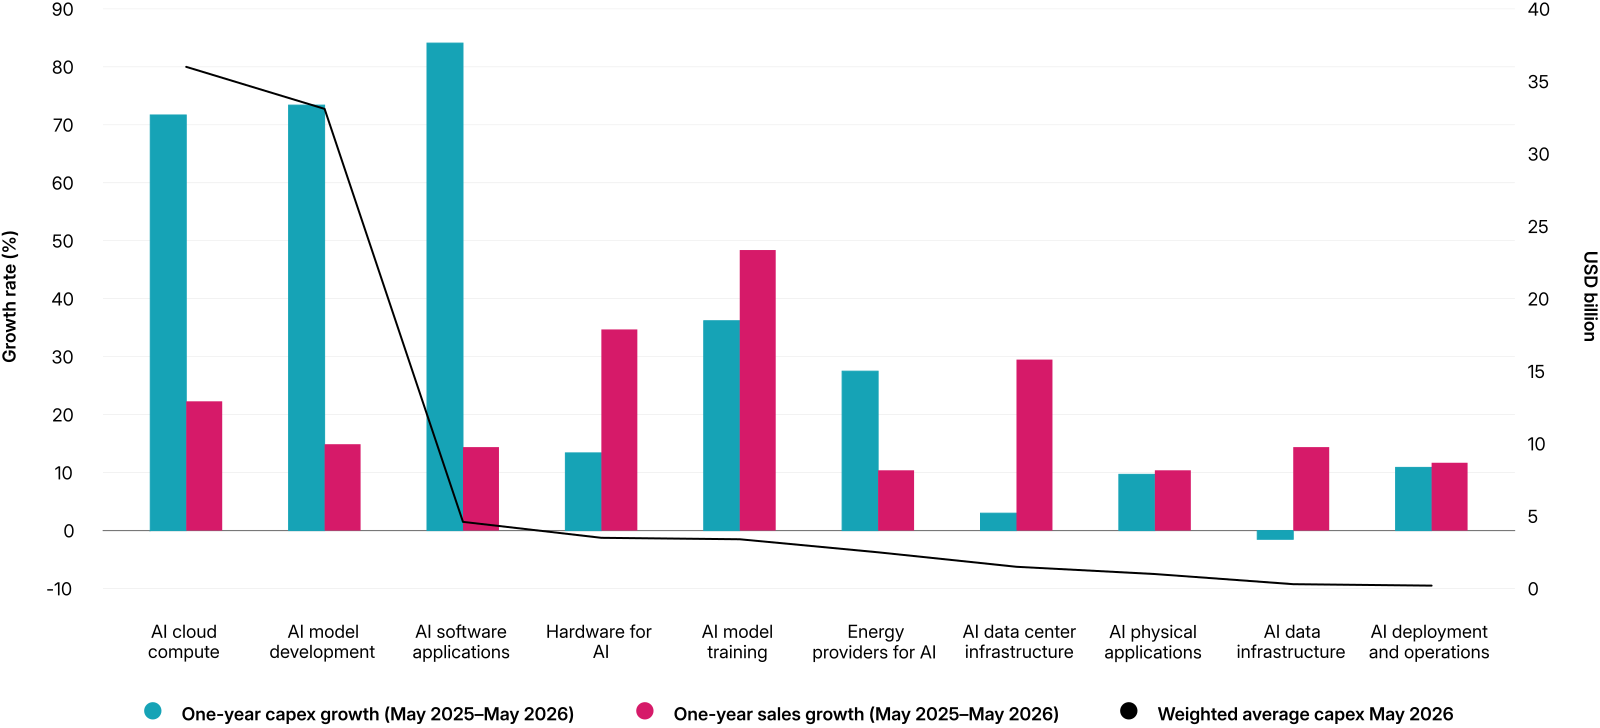
Capex and Sales use MSCI Fundamental Data Methodology and are measured on a trailing-12-month (TTM) basis. TTM values are based on companies' most recently available disclosures and may lag the true TTM window by several months, depending on reporting frequency. Capex values do not capture off-balance-sheet financing arrangements, such as those conducted through special-purpose vehicles or similar structures.
Many of the infrastructure and model-layer components that experienced the largest drawdowns entered the correction trading at or near their highest price-to-book multiples of the past five years. These were precisely the areas with the least valuation support and the greatest concentration of beta and momentum exposure.
Forward earnings multiples, by contrast, were much closer to their historical averages. Balance-sheet valuations were far more stretched than earnings expectations going into the correction.
This divergence suggests the sell-off was a valuation unwind of an expensive asset base rather than a material downgrade of future earnings growth. Investors must therefore ask whether today's infrastructure investment ultimately translates into future earnings, not whether AI demand itself has fundamentally weakened.
Based on quarterly valuation data between August 2021 and May 2026.
For institutional investors, the recent correction highlights that AI exposure is no longer a single thematic allocation. Performance has diverged meaningfully across the value chain, with infrastructure, model development and applications responding differently to shifts in positioning and fundamentals. The MSCI AI Value Chain Indexes allow investors to decompose portfolios across individual layers and components, providing a systematic framework for identifying where AI exposure resides and how it evolves over time.
The past five weeks illustrate why that distinction matters. What unwound was not AI as a broad investment theme, but a concentrated segment of the value chain where positioning, momentum and valuations had become increasingly stretched. Investors should map their AI exposure to these layers now, so they are prepared if another sell-off occurs.



Subscribe todayto have insights delivered to your inbox.
Mapping AI Exposure Across Global Markets
AI's geography is more distributed than headlines suggest — we map which economies lead each layer of the value chain and what that means for global equity investors.
Markets in Focus: AI's Partners Become its Prey
U.S. software is being repriced as AI's next casualty — but with earnings forecasts still rising, the market may be moving far ahead of the disruption it fears.
MSCI AI Value Chain Indexes
The MSCI AI Value Chain Indexes assess each company's involvement in the AI value chain across 10 components representing its key nodes, using segment revenue and company-news attention to capture exposure across the AI ecosystem.
1 Each company is assessed for involvement in the AI value chain across 10 components representing the key nodes in the value chain, using segment revenue and attention from company news. The components span three layers: physical AI infrastructure (hardware for AI, AI data-center infrastructure and energy providers for AI), digital AI infrastructure (AI cloud compute, AI data infrastructure, AI model development, AI model training and AI deployment and operations) and AI applications (AI physical applications and software applications). A company's AI-value-chain score reflects its highest exposure across these components.
2 Between June 22 and July 28, beta fell 6.4% in the U.S., 7.4% in Korea and 4.0% in Taiwan. Momentum drawdowns ranged from 3.0% to 4.9% across the three markets, and residual volatility declined consistently as well, though by a smaller margin.
3 Nell Mackenzie and Amanda Cooper, "AI selloff drives quant funds' worst performance since August," Reuters, July 9, 2026.
The content of this page is for informational purposes only and is intended for institutional professionals with the analytical resources and tools necessary to interpret any performance information. Nothing herein is intended to recommend any product, tool or service. For all references to laws, rules or regulations, please note that the information is provided “as is” and does not constitute legal advice or any binding interpretation. Any approach to comply with regulatory or policy initiatives should be discussed with your own legal counsel and/or the relevant competent authority, as needed.