
Why MSCI Market Classification Matters
- The differences between DM, EM and FM equities affect portfolio construction. In DM, industry and style factors explain most return dispersion, while in EM and FM, country factors remain the dominant driver of performance.
- Our 2026 market-classification review found the gap in market accessibility has continued to widen at each stage of market development, with deterioration evident across all 18 accessibility measures that we monitor.
- Market-classification decisions influence benchmark allocations and trading activity around index-review dates, and give exchanges and policymakers a transparent, investor-centric framework to assess market reforms.
Mentioned in this blog post:
MSCI Global Equity Factor Models | MSCI Market Classification Framework | MSCI Emerging Markets Indexes
In March 2026, MSCI announced the reclassification of Greece from emerging- to developed-market status, making it the first market in MSCI's history to regain its classification as a developed market. This classification event mattered immediately for investors tracking or benchmarked to the MSCI Emerging Markets Indexes, but we detail how the classification framework has relevance to a broader set of investors, how it works and how market accessibility and investability vary across market segments.
Developed, emerging and frontier markets (DM, EM and FM) are often regarded as a single equity asset class differentiated primarily by their stage of development. However, the underlying drivers of returns differ materially across these market segments, with important implications for portfolio construction. These differences can be illustrated by examining the drivers of cross-sectional volatility (CSV) in stock returns.
CSV measures the dispersion of stock returns within an equity universe and provides a useful measure of the opportunity set available to investors. When dispersion is low, stocks tend to move together, limiting the value of security selection. When dispersion is high, active managers have greater potential to add value through stock selection and reweighting. MSCI decomposes CSV into country, industry and style components. The decomposition of CSV, not just its level, can offer a useful framework for understanding the fundamental differences between the three markets.
Drawing on monthly data from January 1997 for DM and EM and from January 2011 for FM through April 2026, the results show that what drives return dispersion shifts markedly across the three segments. In DM, industry factors typically accounted for 35% to 55% of return dispersion — a share that trended upward in recent years — while style factors contributed 30% to 50% and country effects fell to just 12% to 15%. This is consistent with economic integration, high market liquidity and prevalence of systematic investing and indexation in DM. EM returns remained primarily country-driven, which explained 60% to 90% of CSV for most of the period, falling below 50% in the latest readings. FM were even more dominated by country effects (85% to 95% of return dispersion), while industry and style influences were minimal. These patterns suggest that the balance of factors driving return dispersion varies across these markets, reflecting differences in market structure as well as the stage of market development.
MSCI Global Equity Factor Models. Monthly data from January 1997 (DM and EM) and January 2011 (FM) through April 2026. Factor contributions computed using MSCI’s cross-sectional regression framework across DM, EM and FM universes.
The MSCI Market Classification Framework formalizes the distinctions described previously through three criteria. Economic development, which is relevant only to DM assessments, requires a country’s gross national income per capita to be 25% above the World Bank’s high income threshold for three consecutive years.1 Size and liquidity defines minimum-investability thresholds that vary by classification status, ensuring each market has a sufficient number of companies meeting MSCI standard index size and liquidity criteria on a consistent basis. Market accessibility captures the conditions that determine how easily foreign institutional investors can participate in a market, assessed on a qualitative scale across 18 specific measures grouped into five subcategories and reviewed annually.2
MSCI 2026 Market Accessibility Review, June 2026. Percentages calculated by count of markets.
The MSCI 2026 Market Accessibility Review showed that the differences between classifications run across all 18 accessibility measures.3 DM received high ratings across nearly every criterion. By contrast, EM and FM exhibit a progressively greater prevalence of features that fall short of investor expectations for market accessibility, particularly with respect to foreign-exchange liberalization, clearing and settlement, transferability, stock lending and short selling. These are practical differences that map to operationally distinct trading environments with significant variance in transaction cost, settlement risk and counterparty infrastructure.
Investment costs generally increase in markets with lower levels of liquidity and market accessibility, reflecting differences in trading costs, market infrastructure and operational constraints. These characteristics are more commonly observed in EM and FM than in DM.
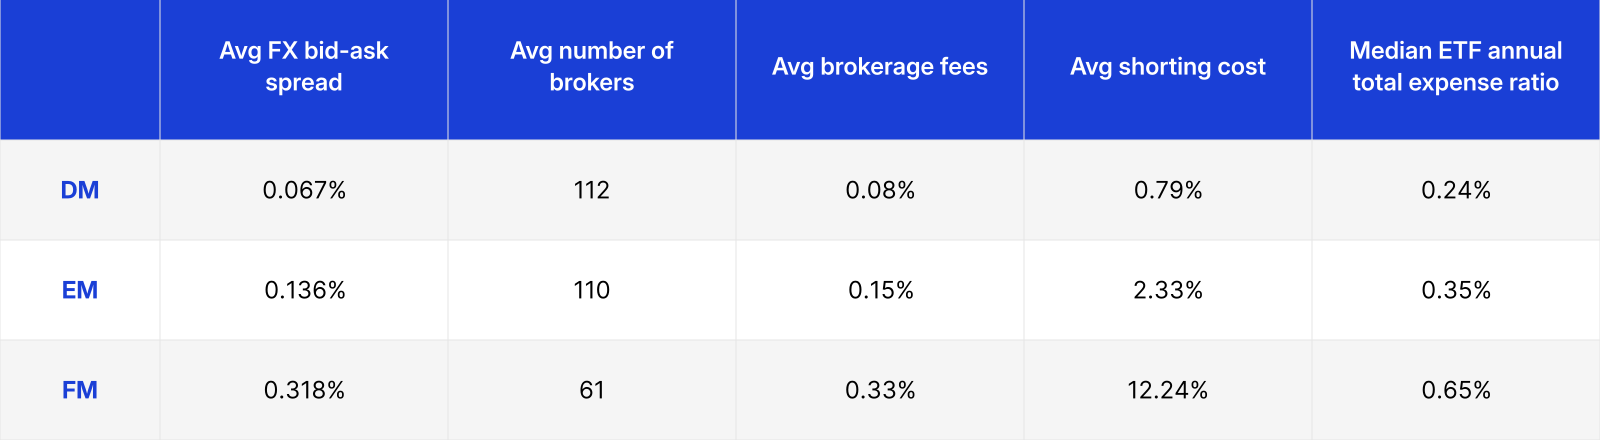
Sources: LSEG Workspace for FX bid-ask spread, calculated using daily data from June 15, 2021, to June 15, 2026. FX bid-ask spread calculated as (ask – bid) / ask for each currency pair vs. USD. Thomas Murray for number of brokers and brokerage fees. FIS Astec Analytics for shorting cost, calculated using daily data from June 15, 2021, to June 15, 2026. Lipper for total expense ratios, covering ETFs with MSCI benchmarks that have exposure to only a single market classification among DM, EM and FM.
Foreign exchange provides a clear example. The average bid-ask spread increases about fivefold between DM and FM. Average brokerage fees increase about fourfold between DM and FM, as the number of brokers serving a market shrinks by nearly half. As a result, executing a trade in an FM might cost nearly five times as much as an equivalent transaction in a DM.
The cost of shorting follows the same pattern: Average shorting costs experience a fifteen-fold increase from DM to FM, which reflects both the scarcity of securities available to borrow and underdevelopment of securities-lending infrastructure in lower-tier markets. These figures cover only markets where shorting is operationally possible; markets with outright shorting restrictions are excluded from the calculation, meaning the constraint is wider than the cost figures alone suggest.
Overall, these frictions feed through to higher implementation and operating costs, as measured by the roughly 40-basis-point difference in median annual total expense ratio between DM- and FM-focused ETFs.
Market classification is about more than just index membership. Changes in market accessibility can influence capital allocation, portfolio construction, trading activity and market development. The MSCI Market Classification Framework provides investors with a transparent benchmark for assessing these changes. For investors benchmarked to MSCI indexes, reclassification decisions may result in portfolio adjustments as markets transition between the MSCI World, Emerging Markets and Frontier Markets Indexes. Timelines for index implementation give advance notice but for replication, the associated trading is often concentrated around the rebalance day itself, leading to heightened execution demand, price impact and higher implementation costs for investors tracking the index.
More broadly, the annual equity-market-accessibility review seeks to provide investors with a structured guide to evolving market conditions that might be reflected in future classification changes. Critically, the process is based on a public methodology and incorporates direct feedback from investors about their experience operating in each market. MSCI’s role is to reflect the reality of what investors encounter in practice rather than to drive an outcome. For exchanges, regulators and policymakers, it sets a transparent benchmark against which market reforms and infrastructure improvements can be assessed.



Subscribe todayto have insights delivered to your inbox.
Greece's Journey Back to Developed Market Status
Greece returns to developed market status in May 2027 — the first market in MSCI history to return to Developed Markets after its move to Emerging Markets following the euro sovereign debt crisis.
1 High-income threshold: 2024 GNI per capita of USD 13,935 (World Bank, Atlas method).
2 The five subcategories that make up market accessibility are openness to foreign ownership, ease of capital inflows and outflows, efficiency of the operational framework, availability of investment instruments and stability of the institutional framework.
3 The 18 accessibility measures are investor-qualification requirement, level of foreign-ownership limit (FOL), foreign-room level, equal rights to foreign investors, capital-flow restriction level, foreign-exchange market-liberalization level, investor registration and account setup, market regulations, information flow, clearing and settlement, custody, registry/depository, trading, transferability, stock lending, short selling, availability of investment instruments and stability of institutional framework.
The content of this page is for informational purposes only and is intended for institutional professionals with the analytical resources and tools necessary to interpret any performance information. Nothing herein is intended to recommend any product, tool or service. For all references to laws, rules or regulations, please note that the information is provided “as is” and does not constitute legal advice or any binding interpretation. Any approach to comply with regulatory or policy initiatives should be discussed with your own legal counsel and/or the relevant competent authority, as needed.