
Scenario Analysis: Rates, AI and Oil May Matter More Than US Midterms
Mentioned in this quick take:
MSCI BarraOne | MSCI Macro-Finance Model | RiskMetrics RiskManager
U.S. stocks rose after every midterm election since 1974, often rebounding from a sharp fall. This year, equities stand near a record high, with rates, AI and oil weighing on multi-asset-class investors.
What history says
Across the 13 midterms since 1974, the MSCI USA Index was roughly flat in the six months before the vote. In non-midterm years, the index gained 4% in that same window. It then rose in the six months after every midterm, whichever party won, by 12% on average. Notably, four of the five largest gains followed falls of nearly 20% or more.1
The dollar and Treasury yields showed no consistent pattern.
Higher yields, AI and oil as stress points
Four risks are already in place: fiscal strain, with the 10-year Treasury yield near its highest level since 2002; the Federal Reserve's inflation fight, continuing after its first rate hike since 2023; an AI build-out dependent on hyperscaler spending’s holding up; and energy, with Brent crude above USD 100 a barrel.2
To assess the potential impact, we draw on scenarios from our recent research.3 In two scenarios, the 10-year Treasury yield rises, through a higher term premium or Fed tightening. In the third scenario, from our AI supply-chain analysis, a slowdown in U.S. tech giants' AI spending spreads to the chipmakers and equipment suppliers that depend on it. The fourth is an oil supply-side squeeze that lifts oil by 45%. In three of the four scenarios, rising yields push stocks and bonds down together; only in the AI case do falling yields let Treasurys partly cushion the equity loss. With several downside risks in place, portfolios may not follow the historical post-midterm pattern, and scenario analysis can help multi-asset-class investors stress test their exposure.
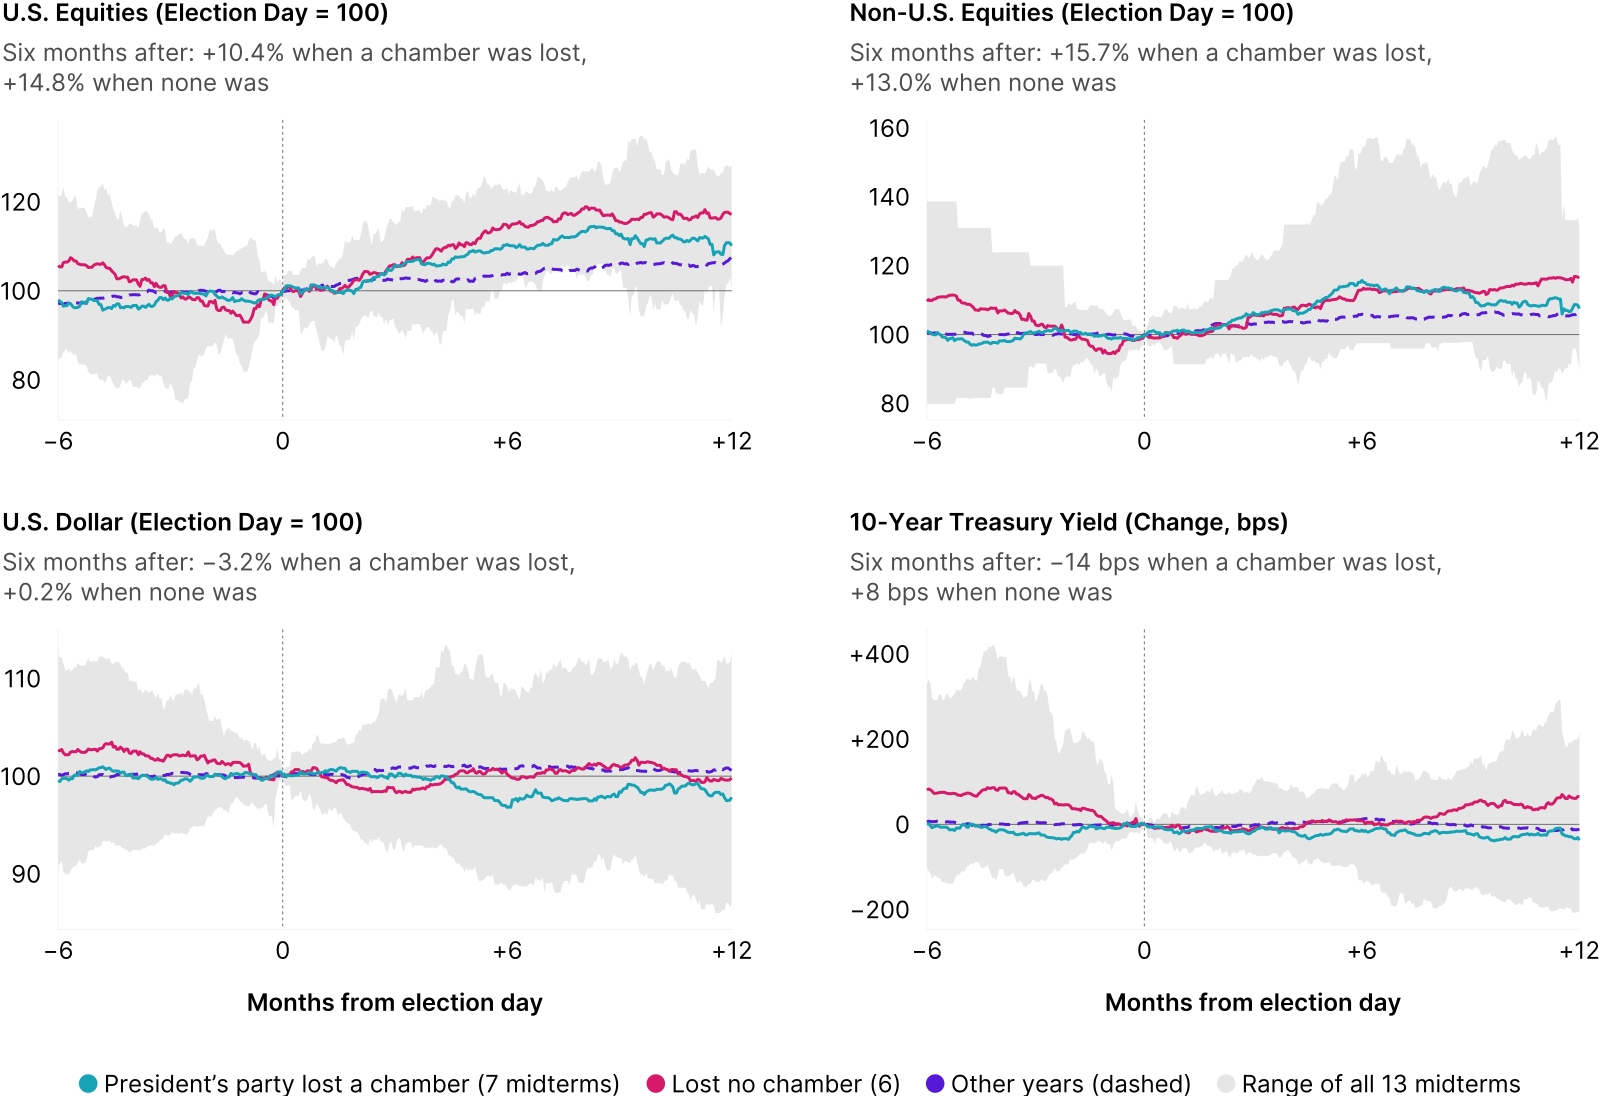
Average path around the 13 midterms since 1974. Equities (MSCI USA and MSCI World ex USA Indexes, USD price returns) and the dollar are rebased to 100 at the Election Day close; the yield is the change in basis points (bps). Lost a chamber: The president's party lost control of the House, the Senate or both. Shading spans the range across all 13 midterms. Other years: non-midterm years from 1972 to 2025, anchored on the same November date. Source: Federal Reserve Bank of St. Louis’s FRED database, MSCI
Scenario impact based on market data as of Oct. 1, 2026. Source: S&P Global Market Intelligence, MSCI


Subscribe todayto have insights delivered to your inbox.
The MSCI Macro-Finance Model
We introduce a framework to understand the financial markets through a macroeconomic lens.
Investment Trends in Focus: Bonds, Bots and Big IPOs
Ashley Lester and Axel Killian look back on a third quarter when fixed income markets came roaring back into the picture.
Scenario Analysis: Two Routes to Higher Treasury Yields
A rise in 10-year Treasury yields can hit portfolios in very different ways. A stronger dollar can cushion losses for non-USD investors; a weaker one can amplify them. See where losses land.
1 These four rebounds took place in 1974, 1982, 1990 and 1998. In each, the MSCI USA Index had fallen 19% to 50% from its previous peak and was still below it on Election Day: by 39%, 2%, 15% and 6%, respectively. Excluding these four, the remaining nine midterms averaged a six-month gain of 8.8%.
2 The 10-year U.S. Treasury zero-coupon yield reached 5.36% on Oct. 5, 2026, its highest since May 2002. The one-month ICE Brent-crude futures price was USD 108 a barrel on Oct. 16, 2026.
3 The results are generated by using model correlations to propagate shocks to the portfolios, using MSCI's BarraOne®. MSCI clients can download the correlated BarraOne stress test and RiskMetrics® RiskManager® stress test. Note that the above stress-test results capture the effect of repricing the assets, not the income component. Treasury inflation-protected securities (TIPS) are represented by the iBoxx TIPS Inflation-Linked Index provided by S&P Dow Jones Indices. U.S. Treasurys, equities and corporate bonds are represented by MSCI indexes. Private equity and private credit are represented by model portfolios. U.S. real estate is represented by the MSCI/PREA U.S. AFOE Quarterly Property Fund Index. The composite portfolio is 35% global public equities, 24% U.S. Treasurys, 2% TIPS, 12% U.S. investment-grade bonds, 2% U.S. high-yield bonds, 10% U.S. real estate and 15% global private assets (13% private equity and 2% private credit).
The content of this page is for informational purposes only and is intended for institutional professionals with the analytical resources and tools necessary to interpret any performance information. Nothing herein is intended to recommend any product, tool or service. For all references to laws, rules or regulations, please note that the information is provided “as is” and does not constitute legal advice or any binding interpretation. Any approach to comply with regulatory or policy initiatives should be discussed with your own legal counsel and/or the relevant competent authority, as needed.