Investors Are Watching the EU Elections
Key findings
- Two policies, the European Economic Security Strategy and the European Green Deal, have been key influences in shaping the recent profile of the EU economy.
- A likely swing to the right after the 2024 European parliamentary elections may require dialogue to build new party coalitions.
- Greater fragmentation in the European Parliament could hinder progress on both key EU policies.
The upcoming European Parliament elections taking place on June 6-9, 2024, could have consequences for EU financial markets. Structural changes in the distribution of seats among members of Parliament, particularly across parties and coalitions, may have the potential to shift the direction and momentum of the overall EU economy.[1]
Breakdown of MEP country representation for the 2024-2029 term
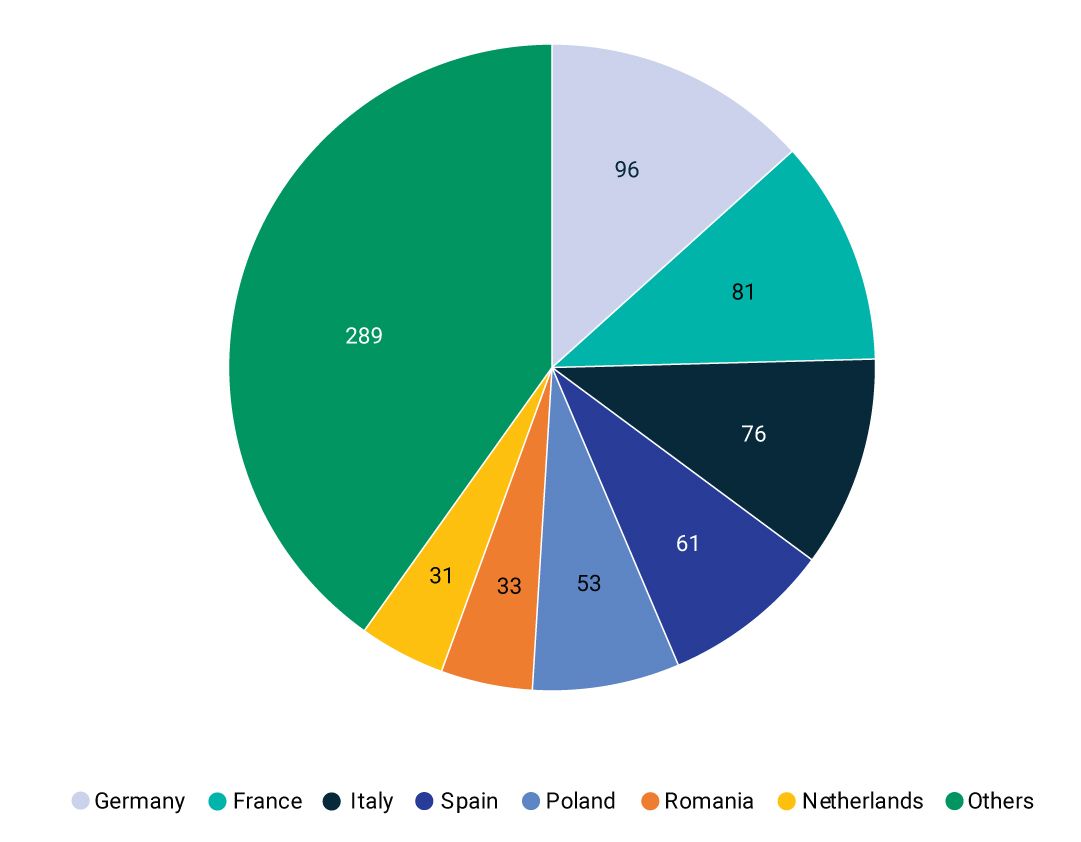
For the next five years, the total number of members in the European Parliament (MEP) has been set at 720. Germany, France, Italy, Spain and Poland collectively account for 51% of all MEPs. Source: European Parliament.
As of May 2024, the center-right European People's Party (EPP) holds the most parliamentary seats, but over the last decade has attracted less support, losing 52 seats in 2014 and another 34 in 2019. While it is expected that the EPP will continue to be the largest party in Parliament, a January 2024 study by the European Council on Foreign Relations predicted a surge in "populist radical right" parties in this year's election.[2] If this were to materialize, we may see slower progress on EU plans, such as the Economic Security Strategy[3] and Green Deal[4] that remain on the 2024-2029 legislative agenda.
The Economic Security Strategy: economic dependencies and geopolitical tensions
The Economic Security Strategy aims to capitalize on the EU's economic openness while reducing risks arising from geopolitical tensions, accelerating technological shifts and economic interdependencies. One goal of the strategy is to promote EU competitiveness and bolster the EU single market.
Using MSCI Economic Exposure data, which tracks the geographic distribution of a firm's revenues, we found that revenue earned by European countries in the U.S. and China markets has grown over the past decade. For instance, Germany's economic exposure to the U.S. increased to 23% in 2024 from 17% in 2013, and its economic exposure to China increased to 8% from 6% over the same period, while France's economic exposure to the U.S. increased to 21% from 15% and to China to 9% from 5%.
Maintaining these interdependencies may require rewiring EU companies' supply chains and nurturing domestic technological progress. The success of these long-term projects will entail attracting capital inflows and maintaining political stability.
Economic exposures of MSCI indexes across Europe and other regions
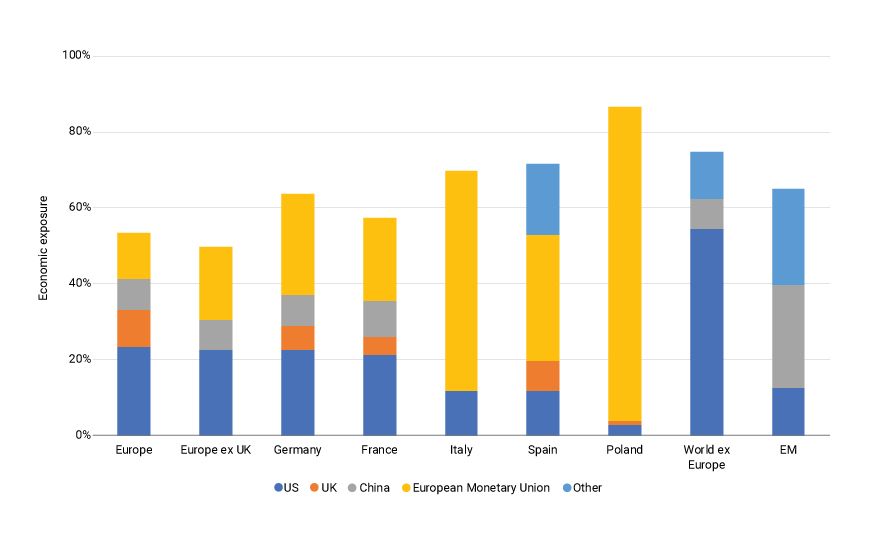
Data as of April 30, 2024. The exhibit compares selected MSCI Investable Market Indexes.
A potential lack of alignment within the European Parliament, pending the outcome of the upcoming election, could reshape the implementation of the Economic Security Strategy and require reassessment of the economic exposures in investors' portfolios.
The Green Deal: ambitions and obstacles
The Green Deal introduced a suite of proposals to implement the EU's climate, energy, transport and taxation policies with the goal of reducing net greenhouse gas emissions and making Europe the first climate-neutral continent by 2050. To achieve these ambitions, the region will need to maintain and expand capital inflows aligned with this goal.
Since May 2014, more European companies have been able to offer low-carbon solutions, particularly in the EU developed markets (DM), although companies in the EU emerging markets (EM) have generally not progressed as far. As of April 30, 2024, green revenue exposures improved, on average, by 41% among the five European countries with the largest representation in Parliament (Germany, France, Italy, Spain and Poland).
Exposures of selected MSCI indexes to companies offering low-carbon solutions
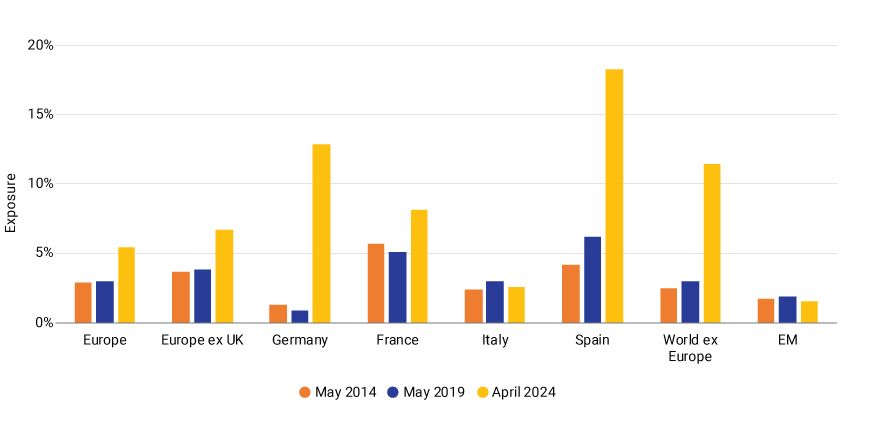
The exhibit compares selected MSCI Investable Market Indexes. Poland is not shown because its green revenue exposure has historically been zero.
And whereas carbon emissions in Europe decreased, on average, by 45% over the last decade, they were down 28%, on average, across developed and emerging markets outside of Europe.
Carbon intensity to EVIC (Scope 1 + 2) of selected MSCI indexes
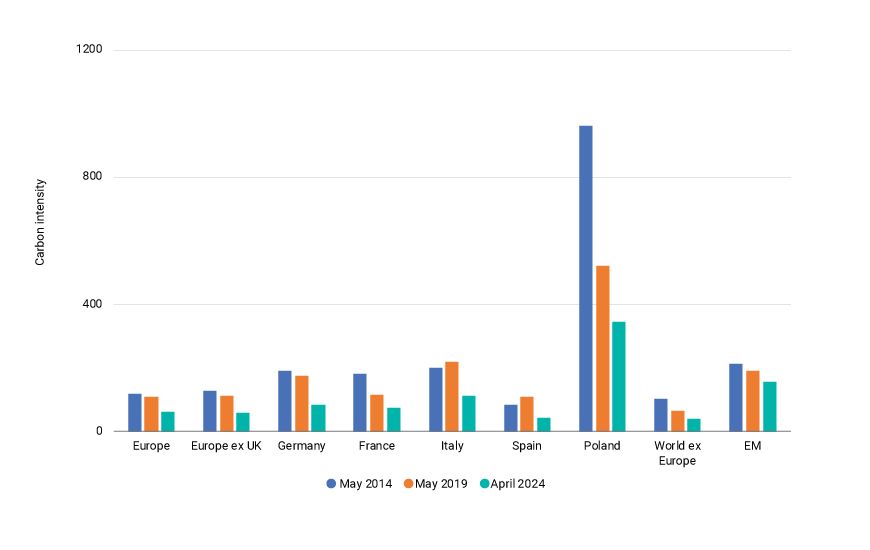
The exhibit compares selected MSCI Investable Market Indexes. Scope 1 + 2 emissions data used for consistency in intensity calculations across time. Intensity calculated as the weighted average of Scope 1 and Scope 2 carbon emissions, normalized by enterprise value including cash (EVIC) in tons per USD million.
If Parliament shifts toward the right after the election, the next steps for the Green Deal may be less clear. These disagreements could impede potential investments in companies that are taking steps in transitioning to the low-carbon real economy, potentially diluting the long-term goals of the Green Deal.
After the election
An anticipated rise of parties to the right of the political spectrum after the upcoming elections could result in a more insular approach in policy making and progress could slow or stall on two key initiatives — the Economic Security Strategy and the Green Deal.
For investors, understanding these dynamics is crucial.
The author would like to thank Stuart Doole for his contributions to this blog post.

Subscribe todayto have insights delivered to your inbox.
1 The number of MEPs per country is proportional to its population, with a maximum of 96 seats and a minimum of 6. As of April 30, 2024, the public equities of France and Germany together accounted for 40% of the market capitalization of the MSCI Europe ex UK Investable Market Index. The five largest markets were France, Switzerland, Germany, the Netherlands and Denmark, with Italy and Spain ranked seventh and eighth, respectively. We classify Poland as an emerging market, although its market capitalization is slightly higher than Ireland's.2 Kevin Cunningham, Simon Hix, Susi Dennison and Imogen Learmonth, “A sharp right turn: A forecast for the 2024 European Parliament elections,” European Council on Foreign Relations (Jan. 23, 2024).3 The COVID-19 pandemic, Russia's invasion of Ukraine and rising geopolitical tensions revealed economic vulnerabilities within the region, compounded by technological shifts. In response, the EU proposed a strategic framework to identify and manage risks to its economic security.4 The threat from climate change and environmental degradation prompted the European Green Deal's aim to achieve net-zero greenhouse gas emissions by 2050 and to decouple economic growth from resource use. One-third of the EUR 1.8 trillion from the NextGenerationEU recovery plan and the EU's long-term budget (2021-2027) will finance this transformation (e.g., emissions reduction of at least 55% by 2030).
The content of this page is for informational purposes only and is intended for institutional professionals with the analytical resources and tools necessary to interpret any performance information. Nothing herein is intended to recommend any product, tool or service. For all references to laws, rules or regulations, please note that the information is provided “as is” and does not constitute legal advice or any binding interpretation. Any approach to comply with regulatory or policy initiatives should be discussed with your own legal counsel and/or the relevant competent authority, as needed.