
Bridging the Measurement Gap Between Drawdown and Evergreen Funds
- Private-market investors assessing the sources of return face challenges in comparing drawdown and evergreen performance, since IRR and TVPI measures do not translate to semi-liquid structures.
- We propose direct alpha as a coherent measure of relative performance across vehicle types. For private credit, this calculation indicates that drawdown and evergreen funds have delivered broadly similar performance.
- Leverage is a critical distinction for investors, however. Making this adjustment, drawdown funds have outperformed their evergreen counterparts by roughly 200 basis points annualized.
Mentioned in this blog post:
Private credit has grown dramatically in recent years and so has the range of vehicles through which investors access it. Drawdown funds remain the traditional institutional format, while evergreen vehicles, including business development companies (BDCs), offer continuously available exposure, limited periodic liquidity and a structure familiar to wealth-management channels.
This expansion has made private credit more accessible, but it has also complicated performance measurement. Drawdown funds are typically evaluated using internal rate of return (IRR) and multiples such as total value to paid-in (TVPI), while evergreen vehicles are generally evaluated using time-weighted returns and index-style performance histories. Both measures can be informative, but only when applied to the appropriate vehicle.
Enter, direct alphaTo bridge this gap, we use direct alpha, which is commonly used to measure excess returns of a private-capital fund relative to a liquid index. Here, we calculate the direct alpha of drawdown private-credit funds relative to the MSCI US Private Credit Evergreen Fund Monthly Index. The resulting direct alpha is an annualized measure of relative performance: Positive values indicate outperformance by drawdown funds, while negative values indicate underperformance.
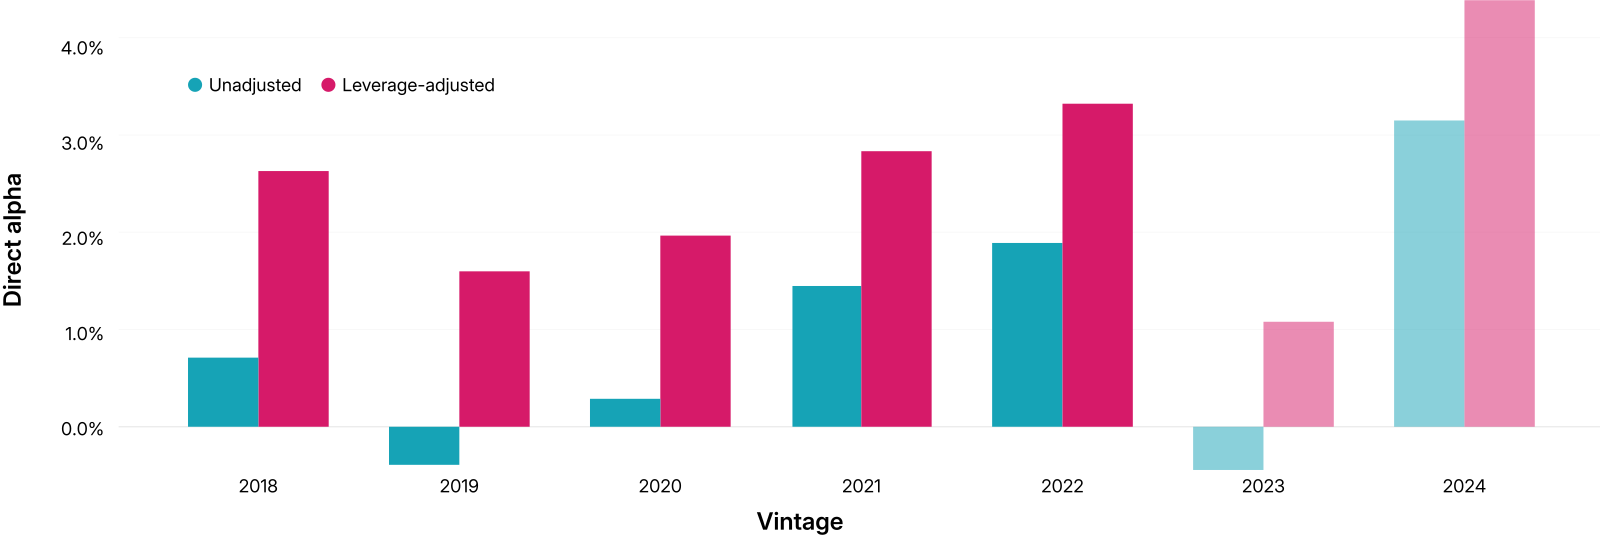
Direct alpha of U.S. drawdown direct-lending funds relative to the unadjusted MSCI US Private Credit Evergreen Fund Monthly Index and to the leverage-adjusted index. Vintages 2023 and 2024 are still young and subject to change, so their performance should be interpreted with caution. Data as of June 30, 2026. Source: U.S. Securities and Exchange Commission, MSCI
We plot two measures by vintage: direct alpha of drawdown private-credit funds relative to the unadjusted evergreen index and a de-levered direct alpha after adjusting for the excess leverage used by unlisted BDCs, including the assumed cost of borrowing at the risk-free rate.
Even after translating drawdown-fund cash flows into a relative direct-alpha measure, differences in leverage, fees and portfolio construction may still affect the comparison. The de-levered direct-alpha measure attempts to put the two vehicles on more comparable footing.
Recent-vintage performance should be interpreted with caution. The volatility of 2023 and 2024 vintage direct alphas reflects young funds with less seasoned portfolios, fewer realizations and residual values that can dominate the calculation.
For that reason, the more informative comparison is among vintages with enough life to make the performance signal more reliable. Focusing on the 2018 through 2022 vintages, the de-levered direct-alpha results suggest that drawdown direct-lending funds outperformed their evergreen counterparts by roughly 200 basis points annualized. The pattern is not perfectly smooth, but it is consistently positive across these vintages.
What might explain the gap?Cash drag is one possible explanation for the gap in performance, because evergreen funds must manage subscriptions and redemptions.1 But this explanation appears inadequate to the scale of the gap: Evergreen private-credit vehicles generally hold minimal cash balances — often around 5% of assets — instead relying on lines of credit for liquidity.
Fees may be part of the story. Evergreen vehicles can involve different layers of expenses than institutional drawdown funds. This is before accounting for additional fees, depending on the distribution channel.
Portfolio construction may play the largest role, though this requires further research. In drawdown private credit, levered funds do not appear to be simply higher-octane versions of unlevered funds. Levered funds often tilt toward larger borrowers and hold less equity exposure, managing risk and return through leverage. Unlevered funds may seek higher returns through smaller borrowers and greater equity participation.
Same asset class, different vehicleThe rise of evergreen private credit has given investors more ways to access the asset class, but it also raises the importance of careful performance measurement.
Direct alpha offers a useful bridge that translates drawdown cash flows into an index-relative return. This analysis suggests that mature drawdown direct-lending vintages have delivered modest but persistent outperformance relative to evergreen private-credit exposure, even after adjusting for leverage. That does not mean one structure is inherently superior, however.
Evergreen vehicles are designed to offer easier access, continuous exposure and periodic liquidity, while drawdown funds may offer a different opportunity set, fee structure and capital-deployment model. For private-market investors, direct alpha provides a more appropriate starting point than simply comparing drawdown-fund IRRs to evergreen index returns.



Subscribe todayto have insights delivered to your inbox.
MSCI US Evergreen Fund Monthly Indexes
Bringing greater transparency to semi-liquid private markets.
The Ascendance and Implications of Evergreen Funds in Private Markets
The rise of semi-liquid vehicles comes bundled with challenges for GPs, asset owners, wealth investors and regulators. MSCI US Evergreen Fund Monthly Indexes show the performance so far.
The State of Private Markets 2026
MSCI's inaugural outlook report examines five forces reshaping private markets — with data and insight for asset owners, general partners and wealth investors.
1 Cash drag refers to the opportunity cost of holding low-return liquid assets to meet potential capital calls.
The content of this page is for informational purposes only and is intended for institutional professionals with the analytical resources and tools necessary to interpret any performance information. Nothing herein is intended to recommend any product, tool or service. For all references to laws, rules or regulations, please note that the information is provided “as is” and does not constitute legal advice or any binding interpretation. Any approach to comply with regulatory or policy initiatives should be discussed with your own legal counsel and/or the relevant competent authority, as needed.