
Do You Know the Real Geographic Exposure of Your Portfolio?
Mentioned in this quick take:
Global equity markets are less exposed to the U.S. than you might think. Nearly 64% of the MSCI ACWI Index is domiciled in the U.S., yet the underlying economic reality is markedly different. If investors look at where portfolio companies generate revenues, manage direct operations or rely on suppliers, exposure to the U.S. drops substantially to just over 40%, with larger shares concentrated in China, Taiwan and the rest of the world.
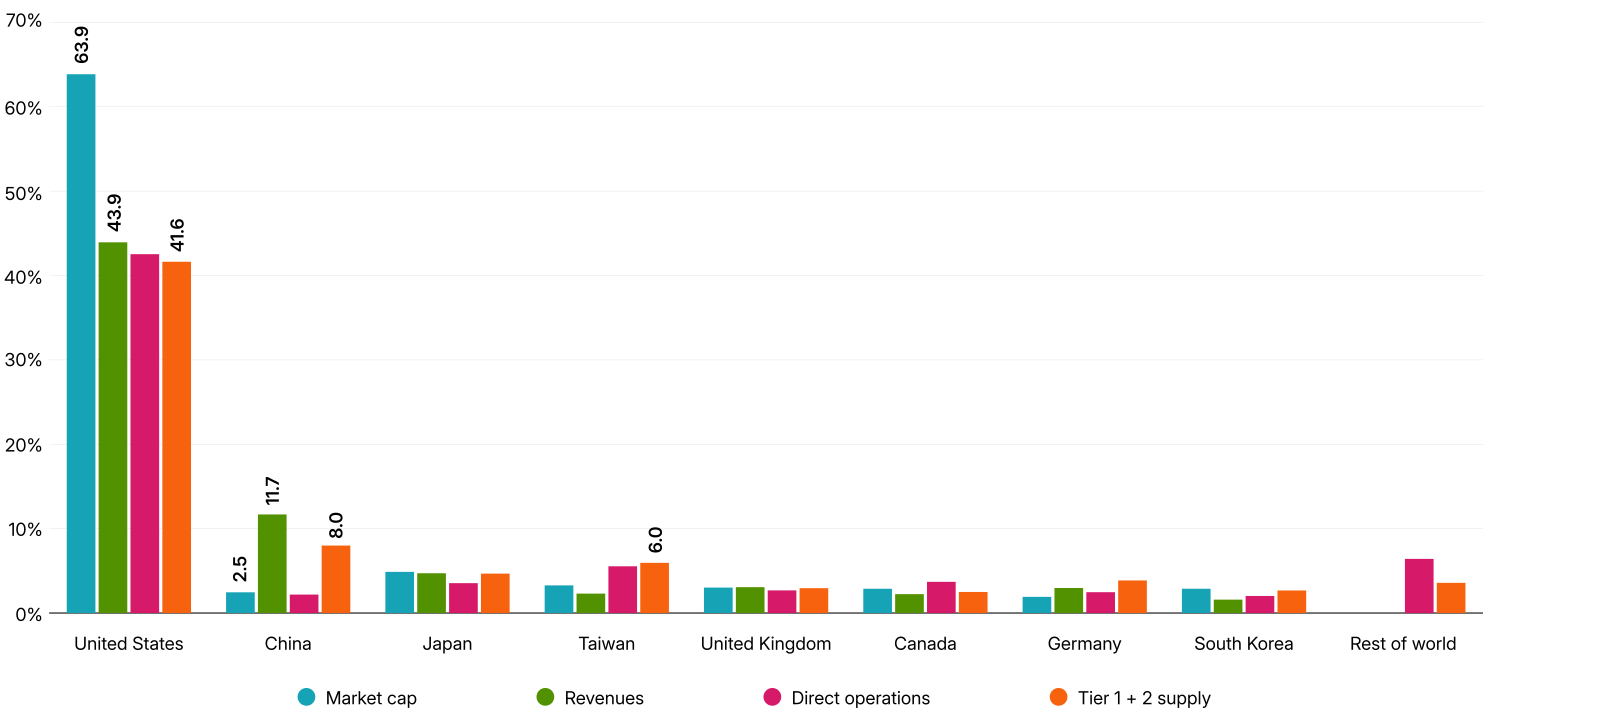
Data as of June 1, 2026. Based on MSCI Sustainability & Climate’s Supply Chain Intelligence (SCi) data. SCi models the upstream supply-chain exposures of more than 11,000 issuers by mapping economic-activity flows across more than 140 regions and 400 activities, anchored on physical-asset locations. Revenue, direct operations and tier 1 and 2 supply-chain exposures are modeled estimates and may differ from company-reported figures. Exposures shown on a market-cap weighted basis.
At the company level, two companies in the same industry and home market can face very different risks depending on their revenue mix and operating models. This was evident in the experience of fertilizer companies following the closure of the Strait of Hormuz, and during policy shocks, trade wars and other conflicts over the past ten years.
At the portfolio level, understanding underlying exposure can offer a different perspective on what drives risk and performance. On a market-cap weighted basis, the MSCI ACWI Index had just below 44% revenue exposure to the U.S., but almost 12% exposure to China — a much greater reliance than might be suggested by China’s 2.5% weight in the index as of June 2026. While nearly 42% of the index’s tier 1 and 2 supply-chain exposure came from the U.S. — driven primarily by services rather than goods — its reliance on goods from China (8.0%) and Taiwan (6.0%) was also notable.
The same logic that applies at the company level extends to the portfolio level. When analyzing scenarios involving trade disruption, tariffs or regional stress, revenue geography, operational footprint and supply-chain reliance may be important drivers of risk alongside where a company happens to be listed.


Subscribe todayto have insights delivered to your inbox.
Uncovering Supply-Chain Risks in the Iran War
The Iran war hit global markets unevenly. We map three hidden channels — revenue, operations and supply chains — revealing where conflict risk truly sits in equity portfolios.
Hormuz Disruption Highlights Supply-Chain Risk in Fertilizer Stocks
Middle East gas disruption revealed how indirect supply-chain exposure drove divergent fertilizer-stock performance, highlighting hidden risks beyond direct operations and geographic revenue exposure.
The content of this page is for informational purposes only and is intended for institutional professionals with the analytical resources and tools necessary to interpret any performance information. Nothing herein is intended to recommend any product, tool or service. For all references to laws, rules or regulations, please note that the information is provided “as is” and does not constitute legal advice or any binding interpretation. Any approach to comply with regulatory or policy initiatives should be discussed with your own legal counsel and/or the relevant competent authority, as needed.