
How Greenhouse-Gas Mix Will Influence Costs Under the SBTi’s OER
Mentioned in this quick take:
MSCI Carbon Markets | MSCI Carbon Credit Price Indexes | MSCI Carbon Project Ratings
We previously introduced the SBTi’s Ongoing Emissions Responsibility (OER) framework and uptake in the voluntary pre-2035 phase. Here we examine the type of carbon credit a company must use — which has large cost implications.
Pre-2035, reduction credits are permitted. These currently trade at USD 3.6/tCO2e, although there are significant variations by project type, from USD 1.0 to 6.8, with higher-quality credits at USD 8.6.1
From 2035, only removal credits are expected to qualify. Critically, companies must ramp up the share of long-lived greenhouse gases (GHG) — e.g., CO2 and N2O — which must be neutralized with long-lived, rather than short-lived, removals; short-lived gases such as methane can always be addressed with short-lived removals. The SBTi has issued a call for evidence that could expand the role of short-lived removals in future iterations.
The distinction is storage durability.2 A rough proxy is that nature-based removals (e.g., afforestation) are short-lived while engineered removals are long-lived. A nature-based removal paired with durable geological storage, or captured CO2 used as a short-lived feedstock, can fall on the opposite side, however.
Long-lived removal credits currently trade at a minimum average of USD 130/t, while short-lived removals are around USD 15/t.3 Because we forecast a future rise in prices, coupled with the durability ramp, two companies on ostensibly identical emissions trajectories can face very different costs. Take two companies, each emitting 1 MtCO2e in 2035, reducing to 200 ktCO2e by 2050. Company A, a cement maker, emits almost 100% long-lived CO2, so must cover more of its footprint with more expensive long-lived removals; Company B, a waste manager, emits 60% methane, so much of its obligation can be met with cheaper short-lived removals.
The emissions coverage and durability ramps, alongside forecast credit prices, push costs up over time, but falling emissions pull the other way, meaning annual costs rise to a peak before easing toward the net-zero year.
This results in a cumulative cost of roughly USD 700 million for Company A versus USD 420 million for Company B, demonstrating the different bills for the same emissions trajectory. For those complying with the OER, understanding emissions inventory, and the price of eligible credit types, will be crucial to managing costs.
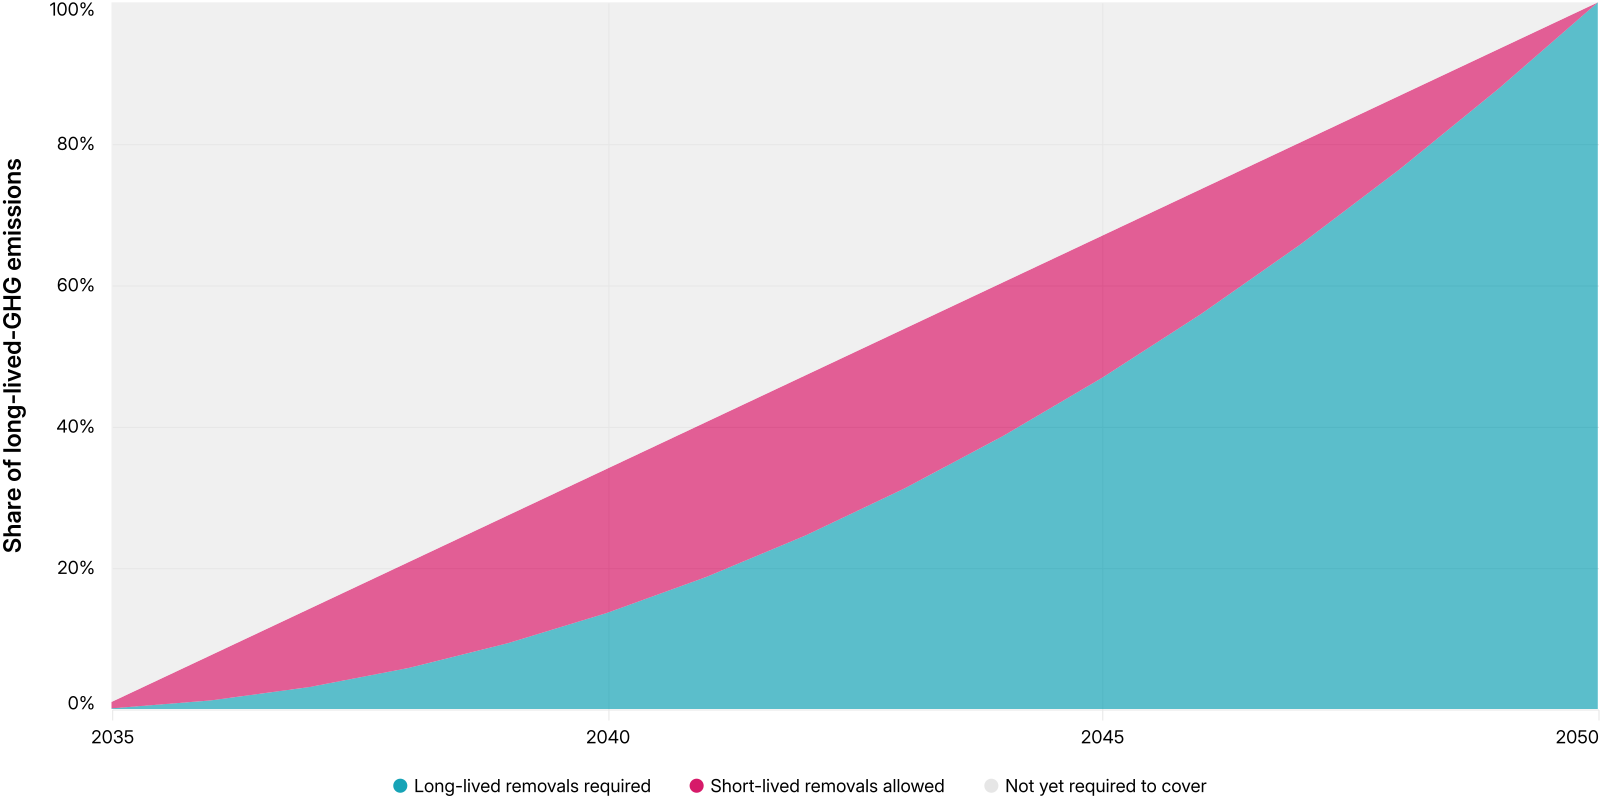
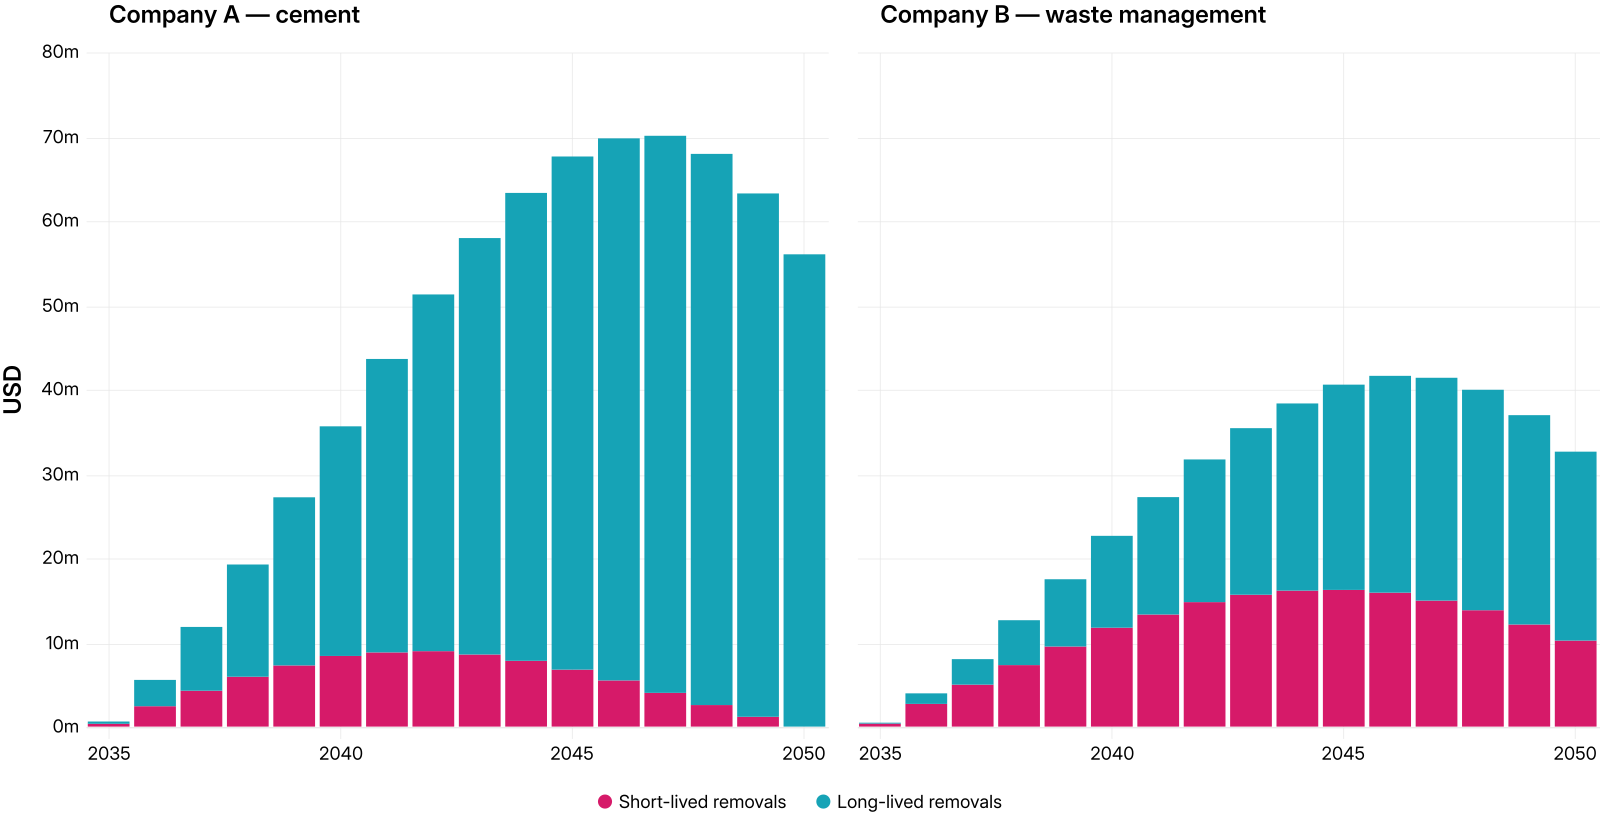
Data as of June 2026. Short-lived removals represented by price forecasts for afforestation, reforestation and revegetation (ARR) credits. Long-lived removals represented by price forecasts for bioenergy with carbon capture & storage (BECCS) credits. Prices as per the high-demand and high-supply scenario. Source: MSCI Carbon Markets


Subscribe todayto have insights delivered to your inbox.
MSCI Carbon Markets
Gain a deeper understanding of carbon markets with our investor-grade data, analytics and insights for companies, banks, investors, project developers and others.
SBTi Opens a New Pathway for Carbon Credits
SBTi's updated net-zero standard gives carbon credits a formal role on the path to net zero under the OER framework, potentially creating new sources of demand in voluntary carbon markets.
Carbon Credits Come of Age in 2025
Carbon-credit markets held steady in 2025, while growing demand for higher-quality and removal credits is reshaping pricing, demand and long-term growth prospects.
1 Twelve-month average of MSCI Global Carbon Credit Price Index (USD 3.6), MSCI Global Renewable Energy Index (1.0), MSCI Global REDD+ Index (6.8) and MSCI Global Rated BBB and Above Carbon Credit Price Index (8.6).
2 Short-lived removals retain carbon for decades to centuries; long-lived for centuries to millennia.
3 12-month average of MSCI Global Biochar Carbon Credit Price Index (USD 130). MSCI Global Afforestation/Reforestation/Revegetation Carbon Credit Price Index (USD 15.0)
The content of this page is for informational purposes only and is intended for institutional professionals with the analytical resources and tools necessary to interpret any performance information. Nothing herein is intended to recommend any product, tool or service. For all references to laws, rules or regulations, please note that the information is provided “as is” and does not constitute legal advice or any binding interpretation. Any approach to comply with regulatory or policy initiatives should be discussed with your own legal counsel and/or the relevant competent authority, as needed.