面包屑导航
Hero image
Story
DEMYSTIFYING THE MARKET STORM: A FACTOR PERSPECTIVE
August 26, 2015
Many market observers could see signs of a coming storm long before stock prices started to slide. Among these indicators were outflows from the large pool of global capital that has flooded emerging markets over the past few years, continued low global interest rates, rising Chinese debt levels and relaxed margin limits and the unexpected slowdown in China’s economy.
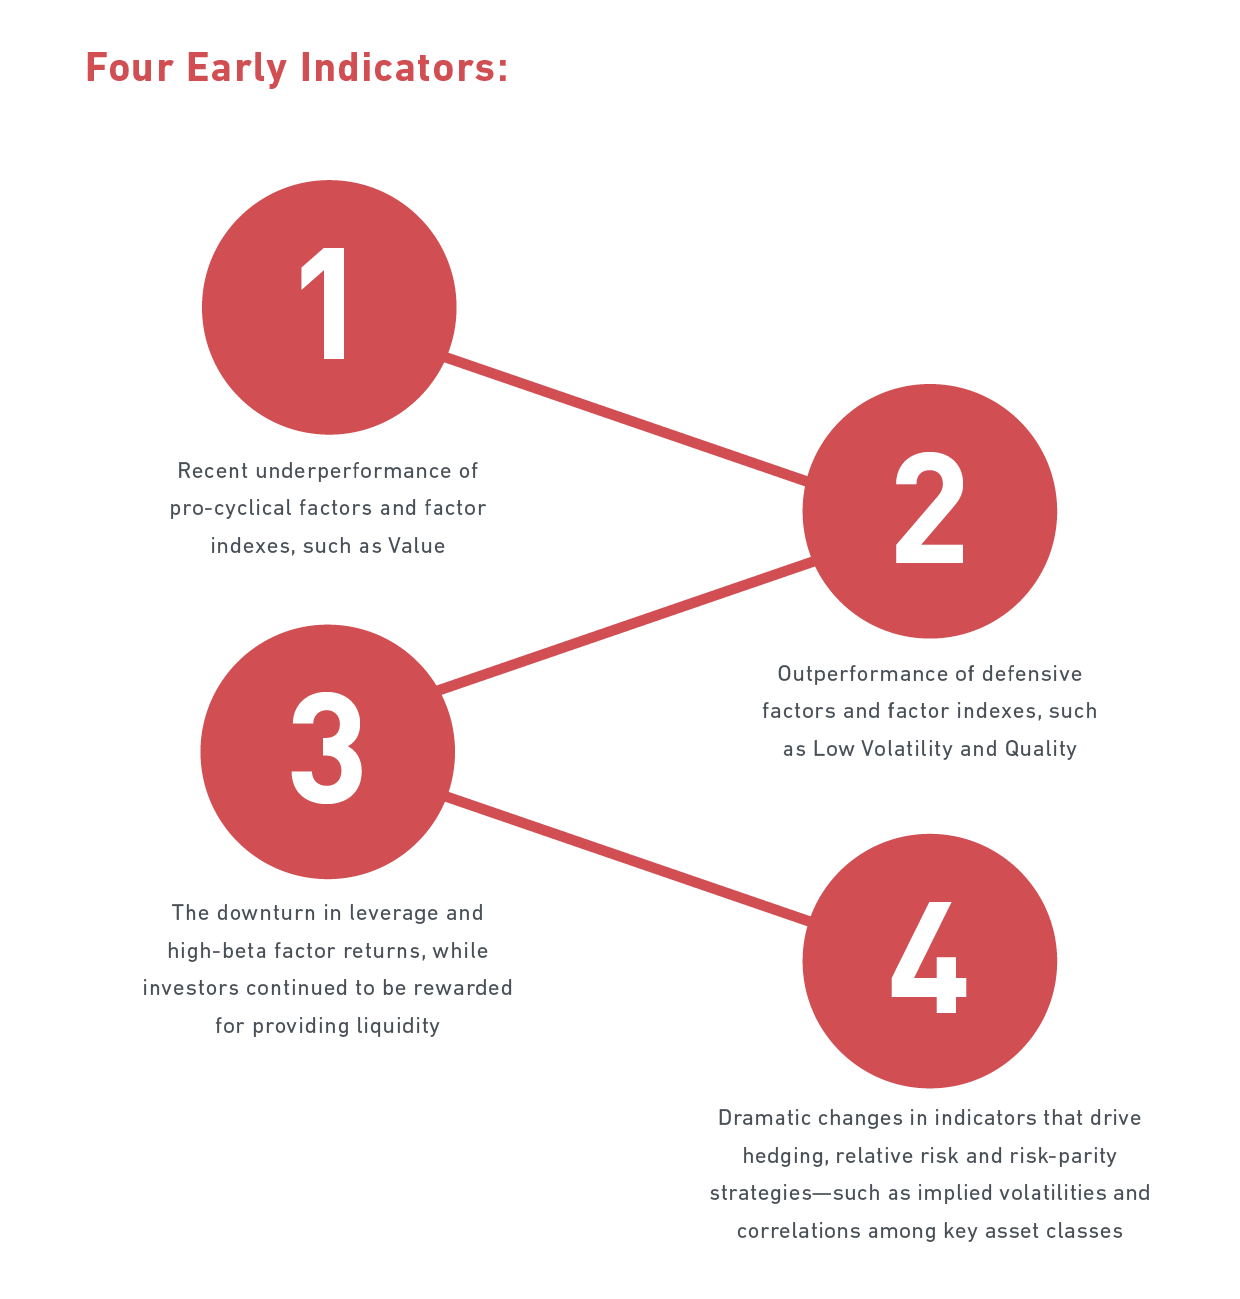
In addition to these major forces, numerous “hidden” factors indicated potential troubles ahead since April. MSCI’s research team have used a factor framework to identify the following less obvious cross-currents affecting equities and other asset classes.
Equity Market Drivers
Looking back over the past few months, signs of a potential coming storm were picked up by MSCI benchmarks, factor indexes and factor models.
MSCI Benchmarks
The sharp decline in global equity markets was indiscriminate in August. Developed market regions fell by about 9% and emerging market regions dropped by 14%. Year to date, the gap in performance between developed and emerging markets is even greater, with the MSCI World Index declining 5.4% compared to a 17.6% plunge for the MSCI Emerging Markets Index.
MSCI Factor Indexes
Looking at MSCI factor indexes, seven of the ten indexes based on the parent MSCI World Index outperformed their parent index by 1% or more (Exhibit 6). The MSCI World Minimum Volatility Index in particular provided substantial relative downside protection during this period, falling only 5.7% versus a decline of 9.8% for the MSCI World Index. In contrast, Value Weighted, Enhanced Value and Momentum factor indexes underperformed in August.
On a year-to-date basis, Minimum Volatility remains the best performer, declining only 0.25% against a drop of 5.4% for the MSCI World Index. Other factor indexes that performed well over this period include Momentum and Diversified Multiple-Factor indexes, while Value Weighted and High Dividend Yield underperformed.
MSCI Factor Models
MSCI factor models showed early signs of a potential emerging risk-off trade in the United States, starting with the poor performance of Residual Volatility and Leverage factor returns, which turned negative on April 17 and May 5, respectively, followed in late June by high-beta stocks underperforming low-beta stocks. Monitoring these factors—especially Leverage— provided a sense of the market-wide sentiment of risk and the effect of Fed policies.
Since the beginning of July, the market has expressed a nuanced preference for high-quality stocks, reflected in the recent positive performance of Quality factors (Earnings Quality, Profitability, Management Quality and Size). This type of market behavior suggests poor growth expectations as investors showed a preference for securities that are expected to outperform in a low-growth environment.
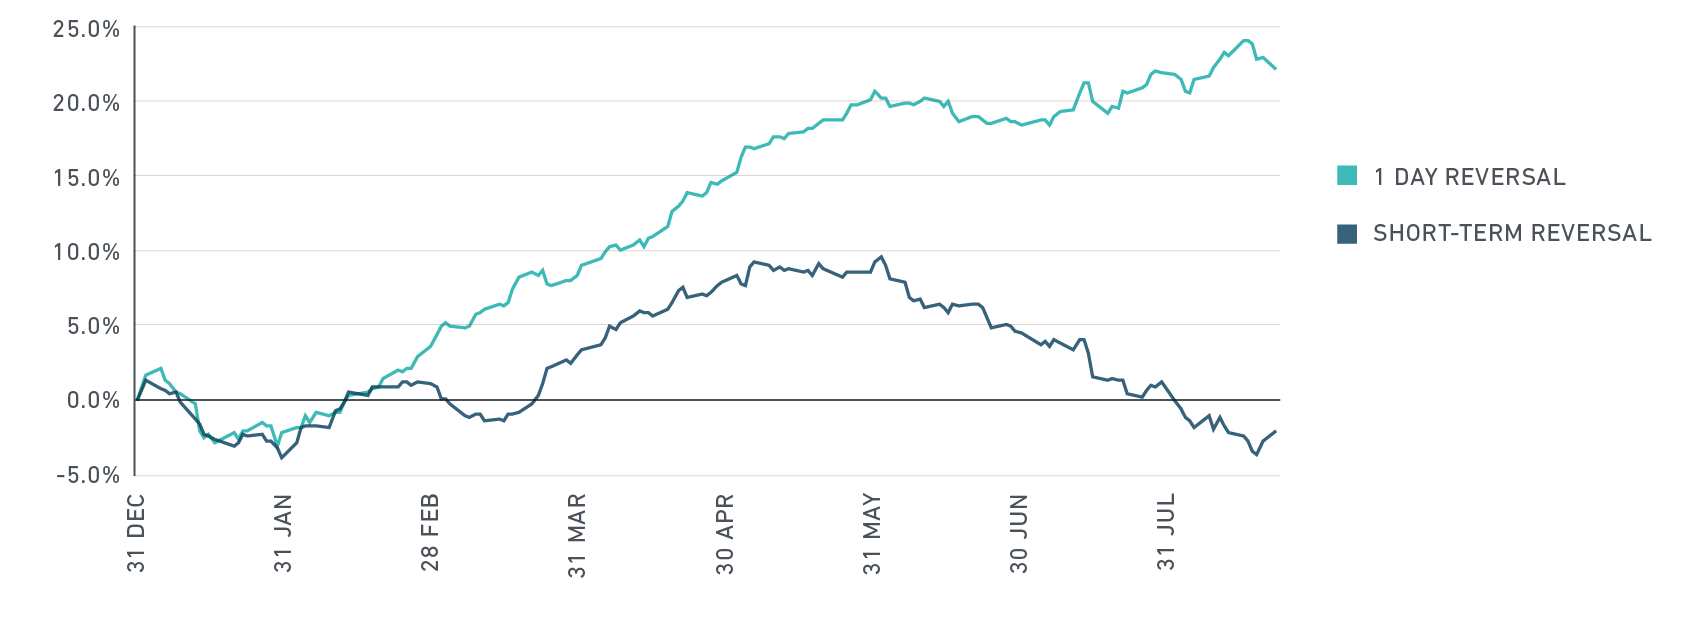
Liquidation indicators (1-day reversal) have not pointed to a market-wide exit to cash. We would typically see significant drawdowns in 1-Day Reversal and spikes in the Short Interest factor when this happens. As investors panic, they tend to liquidate securities to raise cash; this is reflected in market prices as highly shorted securities experience short-covering. Shortterm Reversal factor returns (left panel of Exhibit 1) turned down in June, but 1-Day Reversal returns continued to do well, indicating that investors were rewarded for providing liquidity.
Exhibit 1: Investors Head for Quality, But Not Yet to Cash
Cumulative Performance of Reversal Factors
Quality

Source: MSCI Barra US Trading Model
* Factor returns are rescaled to 8.00% annualized volatility
Looking Forward
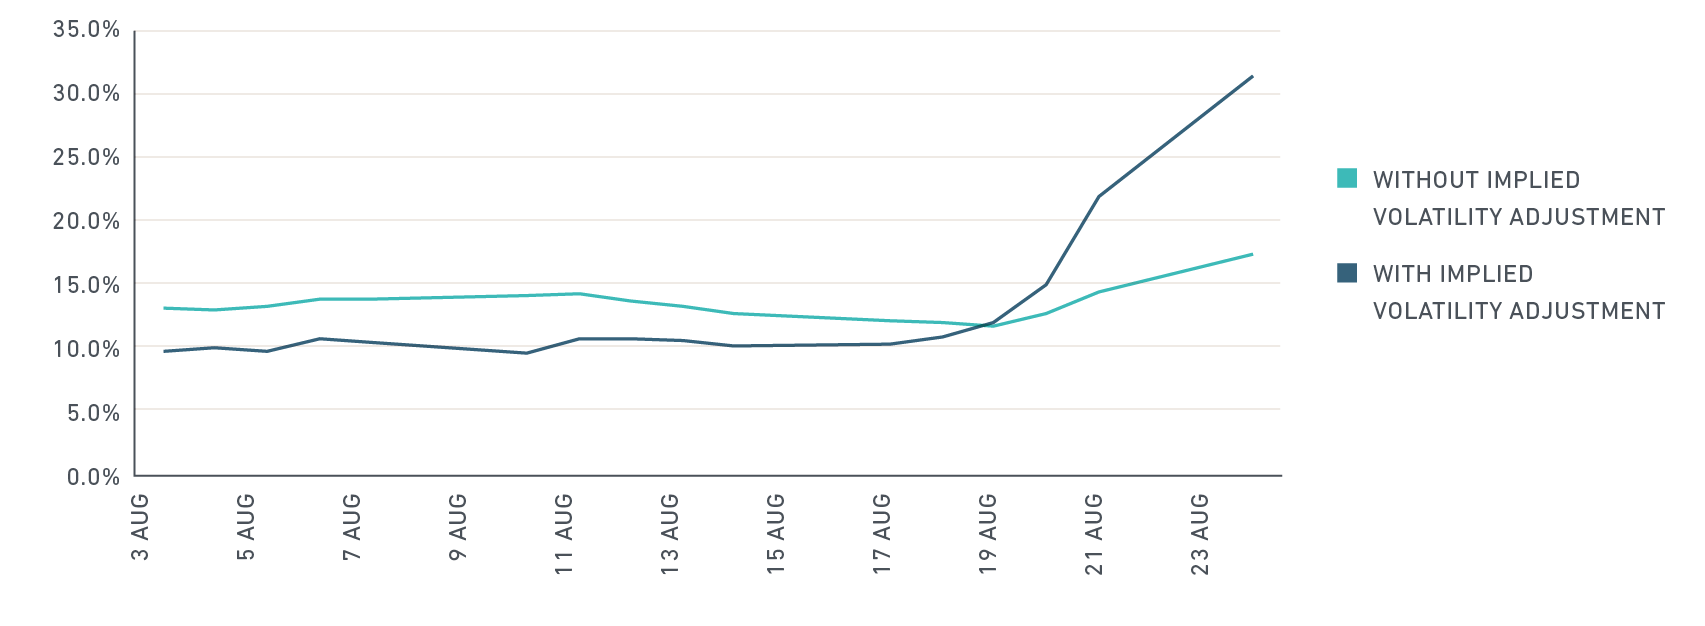
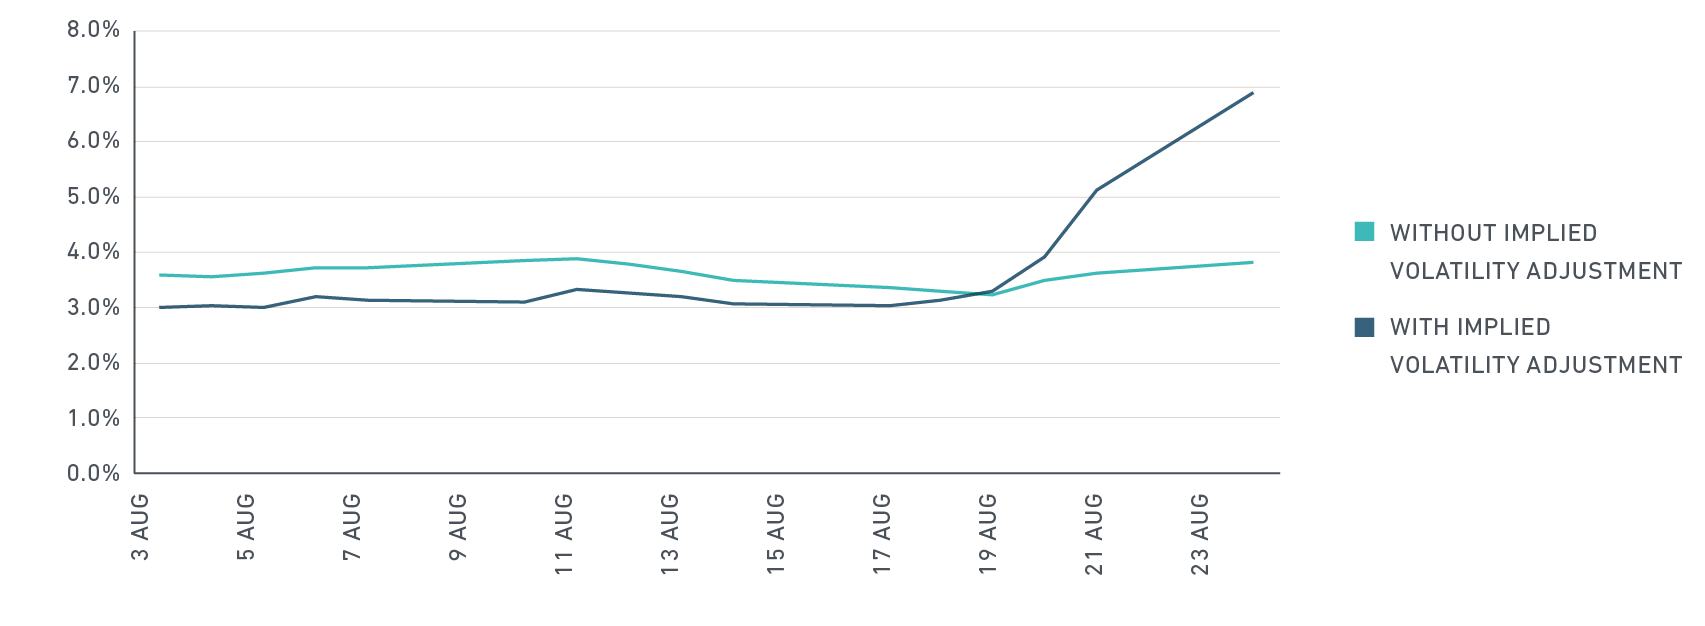
Indicators of potential liquidations, such as the 1-day reversal factor, can be helpful for monitoring shortterm developments. Options markets can also be a leading indicator of further short-term volatility. For that reason, we recently incorporated option-implied volatilities into the MSCI Barra US Trading Model, leading to a significant improvement in short-term risk forecasts. For example, the US Trading Model predicted increased market and beta volatility levels well ahead of the August 24th sell-off.
Exhibit 2: Impact of Option-Implied Volatilities on Predicted Volatility
Market
Beta
Source: MSCI Barra US Trading Model
Performance of Individual Factors
Looking at Exhibit 3, one can see these trends:
• Value indicators, other than Earnings Yield, have struggled this year (Value, Dividend Yield, Long-term Reversal), as can be seen in the top left panel.
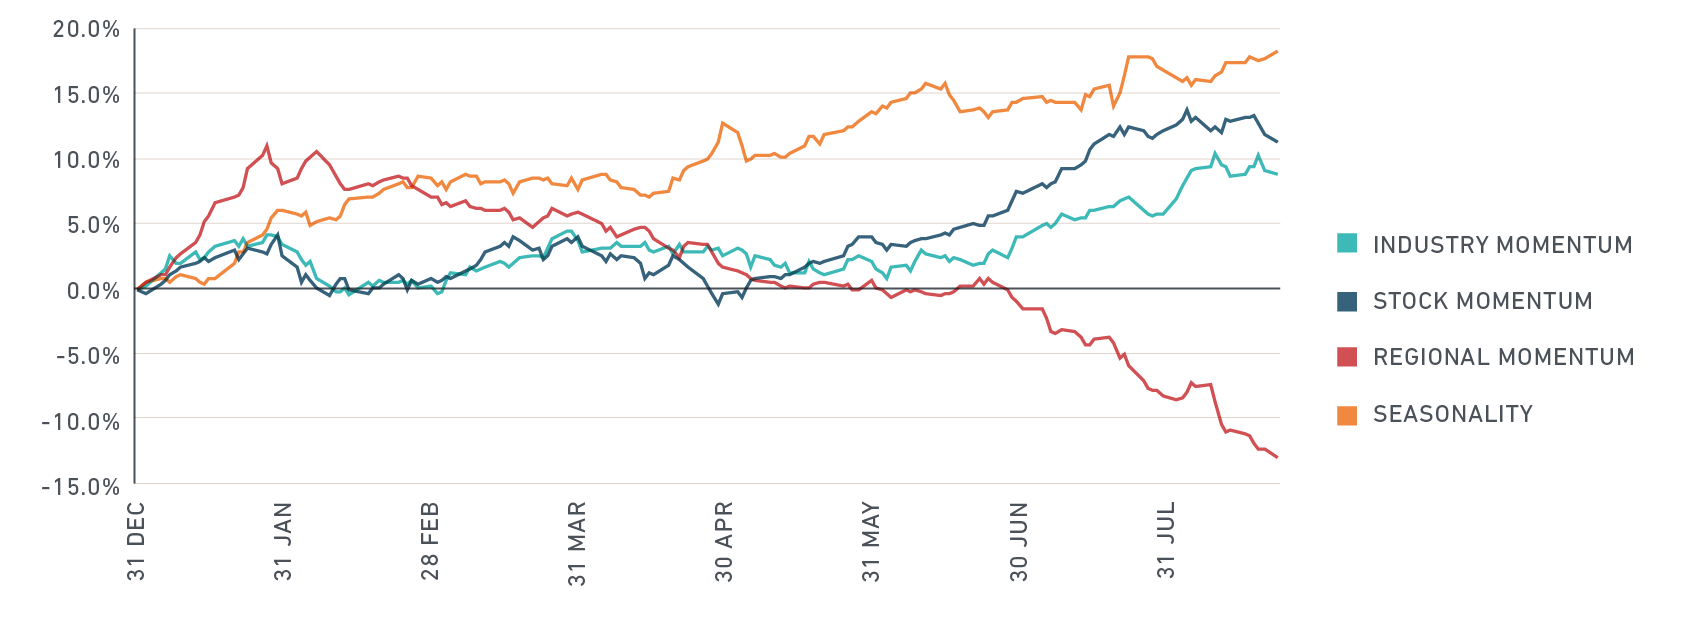
• Stock Momentum, Industry Momentum, and Seasonality have not been affected year to date and have been posting positive performance (top right panel).
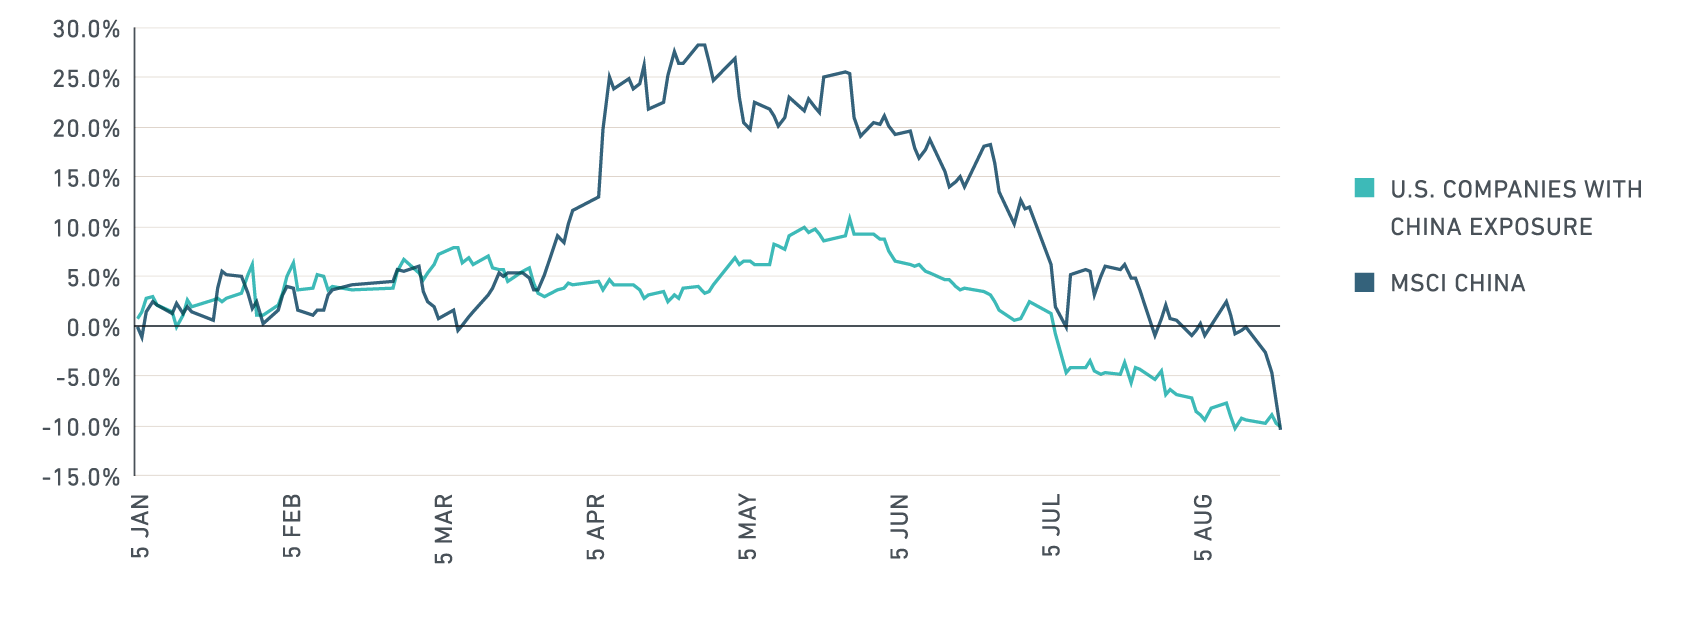
• Regional Momentum, on the other hand, has been performing poorly for most of 2015 to date (top right panel). U.S. companies with exposures to China have been suffering from the recent drawdown in Chinese markets (bottom panel).
Exhibit 3: Performance Varies by Factor in 2015 (YD)
Value

Source: MSCI Barra US Trading Model
Momentum
Source: MSCI Barra US Trading Model
Risk Factors

Source: MSCI Barra US Trading Model
Performance Impact of China on U.S. Companies
Source: BPM, MSCI Economic Exposures, MSCI Barra US Total Market Model
Relationships Among Asset Classes
Dramatic shifts in the relationships among asset classes have also occurred since April 2015. Changes in forecast correlations among leading indexes may affect hedging, relative risk and risk parity strategies across asset classes.
Not surprisingly, U.S. high yield bonds behaved more like broad equity indexes than traditional bond indexes during the period. The correlation between high yield bonds and U.S. equities increased from .29 at the end of April to .46 on August 21. Conversely, correlations between high yield bonds and their less risky counterparts (U.S. Treasuries and high-grade credits) decreased by over 53 percentage points.
On the commodity front, the GSCI Commodity Index’s correlation with equities, which had been low to nearly zero, rose across the board as investors began to tie commodities back to equity markets. In contrast, correlations between commodities and U.S. fixed income indexes (Treasuries and credit) fell by over 65 percentage points, with correlations changing from weak positive in April to strongly negative in August. The largest observed change in correlation was between commodities and U.S. Treasuries, with a -.75 shift from April (.09) to August (-.66).
Certain expected correlations involving currencies also shifted by 40-50 percentage points. The biggest forecast movements among currencies include correlation changes of about 50 percentage points for the Yuan (negative to positive) with the MSCI EAFE Index and the Euro (positive to negative) with the MSCI EAFE and MSCI ACWI indexes. The correlation between U.S. high yield bonds and the Yuan increased by nearly 40 percentage points and the figure for the Euro and the British pound fell by nearly 50 percentage points. These movements may reflect the recent unprecedented decline in the Yuan and the volatility associated with the crisis in Greece.
MSCI Regional and Factor Index Performance
The chart below shows the effect of market movements on MSCI regional and factor indexes over time.
Conclusion
The current market storm is still evolving. In the near future, investors should consider looking for indicators of possible risking liquidations, which could manifest in equity short-covering and/or in declining short-term reversal factors. Additionally, using market implied volatility and asset class correlations may be an effective way to monitor short-term risk aversion, as is monitoring Minimum Volatility and Quality factor investments – which is where many investors have gravitated to ride out this latest turbulence.
'Demystifying the Market Storm' PDF
'Demystifying the Market Storm' PDF
This article has been assembled into a PDF for easy download. Please click the link below to access it.
BARRA® Portfolio Manager
BARRA® Portfolio Manager
Barra PortfolioManager is a cloud-based, interactive platform for the professional equity investor community.
BARRA® US TOTAL MARKET EQUITY MODELS
BARRA® US TOTAL MARKET EQUITY MODELS
Based on the latest research methodologies, the models in the Barra US Total Market Equity Model suite are designed to provide insight across the investment process.
