Factors – Elements of Performance
Factors – Elements of Performance
Factors are the key drivers of risk and return.
The elements capable of turning data points into actionable insight.
Space addition
Factor Indexes performance scorecard
Factor Indexes performance scorecard
MSCI has designed a family of factor indexes that reflect the performance of equity “risk premia” factors (Minimum Volatility, Yield, Quality, Momentum, Value, Size, Growth) across global geographies. In addition to single factor indexes, MSCI also offers multi-factor indexes which aims to give institutional investors a foundation for implementing multi-factor strategies transparently and efficiently. MSCI factor indexes are built using MSCI’s Barra Risk Factor Models used by sophisticated investors for several decades.
Horizontal ruler
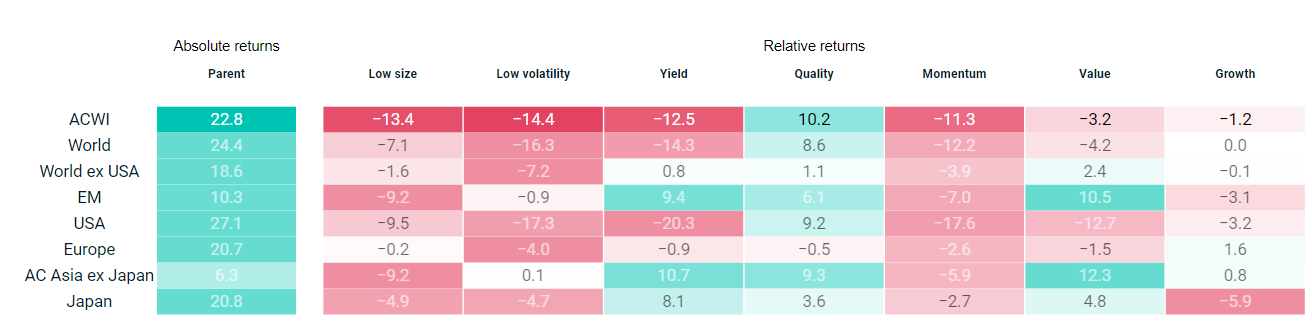
MSCI Factor Index performance heatmap
MSCI Factor Index performance heat map
Factor Performance Heatmap
- ACWI
- World
- EM
- Europe
- World ex USA
- USA
- EMU
- United Kingdom
- AC Asia ex Japan
- Japan
- Australia IMI
- China A
- Brazil
- LATAM
| Index Name | 1D | 1W | 1M | 3M | YTD | 1Y | 3Y | 5Y | 10Y |
|---|---|---|---|---|---|---|---|---|---|
| MSCI ACWI Index | -0.1% | 1.3% | 11.5% | 0.5% | 5.7% | 12.9% | 14.8% | 14.5% | 9.7% |
| MSCI ACWI Minimum Volatility Index | 0.0% | 2.3% | 3.7% | 4.2% | 8.8% | 15.2% | 10.2% | 9.3% | 7.8% |
| MSCI ACWI High Dividend Yield Index | 0.2% | 1.8% | 5.5% | 2.7% | 8.6% | 10.0% | 9.1% | 11.4% | 7.3% |
| MSCI ACWI Quality Index | -0.2% | 1.3% | 10.7% | -2.4% | 2.4% | 7.0% | 16.9% | 14.4% | 12.2% |
| MSCI ACWI Momentum Index | -0.1% | 1.4% | 14.6% | 1.7% | 9.1% | 17.2% | 18.8% | 13.7% | 11.8% |
| MSCI ACWI Enhanced Value Index | 0.7% | 1.5% | 9.3% | 4.9% | 13.4% | 8.4% | 10.1% | 13.1% | 6.1% |
| MSCI ACWI Equal Weighted Index | 0.2% | 1.0% | 7.8% | 3.6% | 8.4% | 8.8% | 7.1% | 9.0% | 5.0% |
| MSCI ACWI Growth Target Index | 0.0% | 1.5% | 10.9% | 3.3% | 10.7% | 17.8% | 17.0% | 15.8% | 11.1% |
| Index Name | 1D | 1W | 1M | 3M | YTD | 1Y | 3Y | 5Y | 10Y |
|---|---|---|---|---|---|---|---|---|---|
| MSCI World Index | -0.1% | 1.3% | 11.7% | 0.1% | 5.3% | 13.4% | 15.7% | 15.4% | 10.4% |
| MSCI World Minimum Volatility Index | 0.2% | 2.7% | 3.6% | 4.4% | 10.6% | 16.7% | 10.8% | 9.5% | 8.3% |
| MSCI World High Dividend Yield Index | 0.2% | 1.8% | 5.0% | 2.0% | 8.3% | 10.0% | 9.6% | 11.8% | 7.6% |
| MSCI World Quality Index | -0.1% | 1.4% | 10.2% | -2.3% | 2.9% | 7.0% | 17.4% | 14.9% | 12.8% |
| MSCI World Momentum Index | -0.2% | 1.3% | 13.4% | 1.4% | 9.3% | 17.2% | 19.1% | 14.7% | 12.7% |
| MSCI World Enhanced Value Index | 0.5% | 1.8% | 9.8% | 4.9% | 13.3% | 12.1% | 12.2% | 14.3% | 6.6% |
| MSCI World Equal Weighted Index | 0.2% | 1.6% | 9.0% | 4.3% | 10.3% | 12.3% | 11.3% | 12.4% | 7.3% |
| MSCI World Growth Target Index | -0.1% | 1.6% | 11.4% | 3.2% | 10.2% | 19.3% | 18.5% | 16.3% | 11.2% |
| Index Name | 1D | 1W | 1M | 3M | YTD | 1Y | 3Y | 5Y | 10Y |
|---|---|---|---|---|---|---|---|---|---|
| MSCI Emerging Markets Index | 0.1% | 1.0% | 9.6% | 4.0% | 9.7% | 9.1% | 7.4% | 7.7% | 4.1% |
| MSCI Emerging Markets Minimum Volatility Index | -0.2% | 0.4% | 5.7% | 4.2% | 5.1% | 10.2% | 6.2% | 7.6% | 3.4% |
| MSCI Emerging Markets High Dividend Yield Index | 0.2% | 1.1% | 8.0% | 5.8% | 10.2% | 12.6% | 11.6% | 9.9% | 3.7% |
| MSCI Emerging Markets Quality Index | -0.4% | 0.9% | 10.7% | 3.0% | 2.7% | 1.9% | 4.9% | 8.0% | 4.0% |
| MSCI Emerging Markets Momentum Index | 0.0% | 1.9% | 11.7% | 4.8% | 8.2% | 11.0% | 6.9% | 7.7% | 5.2% |
| MSCI Emerging Markets Enhanced Value Index | 0.7% | 0.7% | 8.0% | 2.4% | 10.4% | 2.4% | 7.4% | 10.5% | 4.7% |
| MSCI Emerging Markets Equal Weighted Index | 0.1% | 0.4% | 6.4% | 2.8% | 6.1% | 4.8% | 2.5% | 5.3% | 1.7% |
| MSCI Emerging Markets Growth Target Index | 0.1% | 0.6% | 7.8% | 2.2% | 8.1% | 6.5% | 4.7% | 10.0% | 6.1% |
| Index Name | 1D | 1W | 1M | 3M | YTD | 1Y | 3Y | 5Y | 10Y |
|---|---|---|---|---|---|---|---|---|---|
| MSCI Europe Index | 0.9% | 3.0% | 9.8% | 9.9% | 21.3% | 13.1% | 14.9% | 14.3% | 6.6% |
| MSCI Europe Minimum Volatility (EUR) Index | 1.0% | 4.5% | 6.5% | 14.0% | 22.9% | 21.4% | 13.8% | 11.4% | 6.6% |
| MSCI Europe High Dividend Yield Index | 0.9% | 3.5% | 6.7% | 12.3% | 22.0% | 18.2% | 14.4% | 15.9% | 7.0% |
| MSCI Europe Quality Index | 0.7% | 2.5% | 7.6% | 6.0% | 15.9% | 4.8% | 11.5% | 10.8% | 7.4% |
| MSCI Europe Momentum Index | 0.6% | 3.7% | 10.9% | 13.2% | 26.7% | 24.1% | 20.1% | 15.0% | 9.5% |
| MSCI Europe Enhanced Value Index | 1.4% | 3.3% | 12.0% | 13.9% | 27.0% | 20.1% | 15.7% | 17.9% | 6.2% |
| MSCI Europe Equal Weighted Index | 1.0% | 3.1% | 10.2% | 12.5% | 22.3% | 14.9% | 13.0% | 13.4% | 6.0% |
| MSCI Europe Growth Target Index | 1.0% | 3.6% | 10.0% | 13.8% | 23.4% | 21.1% | 19.4% | 17.7% | 8.2% |
| Index Name | 1D | 1W | 1M | 3M | YTD | 1Y | 3Y | 5Y | 10Y |
|---|---|---|---|---|---|---|---|---|---|
| MSCI World ex USA Index | 0.6% | 2.3% | 8.8% | 7.6% | 15.8% | 12.6% | 12.8% | 12.8% | 6.4% |
| MSCI World ex USA Minimum Volatility Index | 0.6% | 3.2% | 4.3% | 11.4% | 17.7% | 20.5% | 11.0% | 8.7% | 5.8% |
| MSCI World ex USA High Dividend Yield Index | 0.7% | 2.8% | 5.5% | 10.2% | 18.3% | 16.1% | 13.9% | 15.1% | 6.8% |
| MSCI World ex USA Quality Index | 0.6% | 2.0% | 8.0% | 4.5% | 12.4% | 4.9% | 10.5% | 9.8% | 7.1% |
| MSCI World ex USA Momentum Index | 0.6% | 3.0% | 9.4% | 9.1% | 17.8% | 16.1% | 15.3% | 12.2% | 7.9% |
| MSCI World ex USA Enhanced Value Index | 0.9% | 2.3% | 9.7% | 11.2% | 20.4% | 17.3% | 15.9% | 16.9% | 6.4% |
| MSCI World ex USA Equal Weighted Index | 0.6% | 1.9% | 8.0% | 8.9% | 16.0% | 13.6% | 10.9% | 10.9% | 5.6% |
| MSCI World ex USA Growth Target Index | 0.7% | 2.8% | 10.4% | 11.4% | 18.1% | 17.0% | 16.2% | 14.9% | 8.1% |
| Index Name | 1D | 1W | 1M | 3M | YTD | 1Y | 3Y | 5Y | 10Y |
|---|---|---|---|---|---|---|---|---|---|
| MSCI USA Index | -0.4% | 1.0% | 12.9% | -2.6% | 1.6% | 13.7% | 17.0% | 16.5% | 12.8% |
| MSCI USA Minimum Volatility Index | -0.1% | 2.2% | 4.7% | 1.0% | 6.6% | 14.3% | 12.2% | 11.5% | 10.6% |
| MSCI USA High Dividend Yield Index | -0.2% | 1.6% | 5.7% | -2.3% | 3.2% | 7.1% | 8.4% | 11.2% | 9.2% |
| MSCI USA Quality Index | -0.3% | 1.4% | 10.3% | -3.5% | 1.6% | 9.8% | 19.3% | 16.2% | 14.5% |
| MSCI USA Momentum Index | -0.4% | 1.0% | 15.1% | 0.6% | 8.8% | 18.1% | 19.9% | 13.9% | 13.6% |
| MSCI USA Enhanced Value Index | -0.2% | 0.9% | 10.7% | -3.0% | 4.2% | 7.7% | 7.4% | 12.5% | 7.7% |
| MSCI USA Equal Weighted Index | -0.3% | 1.0% | 10.5% | -1.7% | 2.7% | 9.8% | 11.4% | 14.3% | 9.7% |
| MSCI USA Growth Target Index | -0.6% | 1.1% | 12.0% | -0.3% | 6.1% | 18.3% | 17.9% | 14.8% | 12.3% |
| Index Name | 1D | 1W | 1M | 3M | YTD | 1Y | 3Y | 5Y | 10Y |
|---|---|---|---|---|---|---|---|---|---|
| MSCI EMU Index | 0.8% | 2.7% | 11.6% | 12.5% | 25.7% | 16.6% | 18.2% | 15.9% | 7.3% |
| MSCI EMU Minimum Volatility (EUR) Index | 1.0% | 3.9% | 8.0% | 15.1% | 25.3% | 20.2% | 14.0% | 11.3% | 6.5% |
| MSCI EMU High Dividend Yield Index | 1.2% | 2.9% | 10.0% | 13.7% | 24.3% | 12.5% | 14.3% | 14.1% | 7.3% |
| MSCI EMU Quality Index | 0.6% | 1.7% | 10.4% | 9.2% | 21.3% | 8.3% | 15.6% | 12.5% | 8.1% |
| MSCI EMU Momentum Index | 0.9% | 4.7% | 13.1% | 17.5% | 32.9% | 29.0% | 22.9% | 16.9% | 11.1% |
| MSCI EMU Enhanced Value Index | 1.1% | 2.7% | 14.5% | 16.8% | 32.2% | 17.6% | 16.9% | 19.8% | 6.7% |
| MSCI EMU Equal Weighted Index | 1.1% | 3.0% | 10.9% | 15.1% | 25.4% | 16.1% | 14.1% | 13.6% | 6.3% |
| Index Name | 1D | 1W | 1M | 3M | YTD | 1Y | 3Y | 5Y | 10Y |
|---|---|---|---|---|---|---|---|---|---|
| MSCI United Kingdom Index | 0.9% | 3.2% | 7.4% | 8.7% | 16.6% | 13.4% | 12.4% | 14.0% | 4.7% |
| MSCI United Kingdom Minimum Volatility (GBP) Index | 1.1% | 3.9% | 7.0% | 10.2% | 17.2% | 18.0% | 12.4% | 13.3% | 4.7% |
| MSCI United Kingdom High Dividend Yield Index | 1.3% | 2.8% | 6.6% | 12.1% | 17.7% | 14.9% | 8.2% | 13.1% | 4.1% |
| MSCI United Kingdom Quality Index | 0.9% | 3.3% | 6.3% | 8.9% | 15.0% | 14.1% | 11.4% | 11.0% | 5.4% |
| MSCI United Kingdom Momentum Index | 0.9% | 3.3% | 8.7% | 13.4% | 23.2% | 24.7% | 17.6% | 15.0% | 7.2% |
| MSCI United Kingdom Enhanced Value Index | 1.4% | 4.9% | 8.6% | 12.2% | 23.6% | 22.5% | 16.6% | 20.8% | 4.9% |
| MSCI United Kingdom Equal Weighted Index | 1.1% | 3.3% | 8.9% | 10.7% | 16.7% | 14.2% | 13.2% | 14.7% | 3.8% |
| MSCI United Kingdom Growth Target Index | 1.1% | 3.5% | 8.1% | 10.9% | 20.4% | 22.0% | 17.0% | 17.4% | 6.3% |
| Index Name | 1D | 1W | 1M | 3M | YTD | 1Y | 3Y | 5Y | 10Y |
|---|---|---|---|---|---|---|---|---|---|
| MSCI AC Asia ex Japan | 0.0% | 1.2% | 10.3% | 3.9% | 8.5% | 10.7% | 7.4% | 7.0% | 4.6% |
| MSCI AC Asia ex Japan Minimum Volatility Index | -0.2% | 0.7% | 6.8% | 4.7% | 4.9% | 12.1% | 6.5% | 6.8% | 3.4% |
| MSCI AC Asia ex Japan High Dividend Yield Index | 0.3% | 1.5% | 8.8% | 3.9% | 6.2% | 13.1% | 12.0% | 11.5% | 5.2% |
| MSCI AC Asia ex Japan Quality Index | -0.4% | 1.3% | 12.0% | 3.6% | 2.4% | 4.8% | 6.7% | 7.0% | 5.4% |
| MSCI AC Asia ex Japan Momentum Index | 0.1% | 2.1% | 12.4% | 5.3% | 7.3% | 13.1% | 6.7% | 9.0% | 6.3% |
| MSCI AC Asia ex Japan Enhanced Value Index | 0.4% | 0.6% | 7.7% | 2.5% | 8.0% | 6.4% | 9.5% | 11.6% | 5.3% |
| MSCI AC Asia ex Japan Equal Weighted Index | 0.0% | 0.4% | 6.5% | 2.2% | 3.9% | 5.3% | 1.2% | 3.9% | 1.6% |
| MSCI AC Asia ex Japan Growth Target Index | 0.1% | 1.1% | 9.3% | 2.8% | 7.7% | 9.5% | 7.5% | 9.6% | 7.1% |
| Index Name | 1D | 1W | 1M | 3M | YTD | 1Y | 3Y | 5Y | 10Y |
|---|---|---|---|---|---|---|---|---|---|
| MSCI Japan Index | 0.4% | 1.0% | 6.0% | 4.1% | 7.4% | 8.3% | 11.4% | 9.2% | 5.8% |
| MSCI Japan Minimum Volatility (JPY) | -0.2% | 0.7% | 1.8% | 6.3% | 9.4% | 12.5% | 9.9% | 4.7% | 4.2% |
| MSCI Japan High Dividend Yield Index | -0.3% | -0.2% | 3.2% | 8.0% | 9.8% | 15.6% | 17.3% | 15.1% | 7.9% |
| MSCI Japan Quality Index | 0.0% | 0.8% | 6.7% | 5.0% | 7.1% | 8.9% | 8.5% | 5.5% | 5.9% |
| MSCI Japan Momentum Index | 0.4% | 1.6% | 7.3% | 4.0% | 7.6% | 9.6% | 14.9% | 10.2% | 6.8% |
| MSCI Japan Enhanced Value Index | 0.2% | 0.4% | 4.8% | 4.6% | 6.8% | 5.8% | 13.8% | 13.5% | 6.5% |
| MSCI Japan Equal Weighted Index | 0.0% | 0.5% | 3.2% | 5.0% | 9.3% | 9.0% | 8.7% | 6.1% | 4.5% |
| MSCI Japan Growth Target Index | 0.2% | 0.6% | 6.4% | 3.5% | 3.8% | -0.7% | 5.2% | 7.1% | 4.9% |
| Index Name | 1D | 1W | 1M | 3M | YTD | 1Y | 3Y | 5Y | 10Y |
|---|---|---|---|---|---|---|---|---|---|
| MSCI Australia IMI Index | -0.2% | 0.0% | 7.8% | 1.7% | 7.2% | 4.9% | 6.1% | 12.2% | 6.2% |
| MSCI Australia Shares IMI Minimum Volatility Index (AUD) | -0.3% | 0.3% | 7.0% | 3.9% | 10.0% | 8.5% | 6.5% | 10.8% | 6.1% |
| MSCI Australia Shares IMI High Dividend Yield Index | -0.6% | -1.2% | 8.1% | 2.1% | 5.2% | -7.8% | 2.9% | 10.4% | 1.5% |
| MSCI Australia Shares IMI Quality Index | -0.1% | 0.0% | 8.5% | 0.5% | 8.1% | 5.3% | 8.9% | 10.3% | 7.8% |
| MSCI Australia Shares IMI Momentum Index | 0.1% | 0.4% | 9.5% | 1.7% | 8.2% | 11.4% | 8.4% | 11.9% | 7.5% |
| MSCI Australia Shares IMI Enhanced Value Index | -0.1% | -0.3% | 8.1% | 3.0% | 8.6% | 6.4% | 5.5% | 15.0% | 7.9% |
| MSCI Australia Shares IMI Equal Weighted Index | -0.4% | -1.4% | 7.8% | 0.1% | 8.0% | 2.7% | 1.4% | 8.1% | 4.0% |
| Index Name | 1D | 1W | 1M | 3M | YTD | 1Y | 3Y | 5Y | 10Y |
|---|---|---|---|---|---|---|---|---|---|
| MSCI China A Index | 0.6% | -0.1% | 4.6% | -0.3% | 1.2% | 7.2% | -2.4% | 2.1% | -1.5% |
| MSCI China A Minimum Volatility Index | 0.6% | 0.0% | 3.2% | 3.6% | 3.2% | 7.0% | 0.6% | 2.6% | 1.6% |
| MSCI China A High Dividend Yield Index | 0.4% | 0.1% | 3.4% | 2.8% | -0.3% | 6.7% | 4.1% | 6.0% | 3.5% |
| MSCI China A Quality Index | 0.6% | -0.5% | 4.3% | -2.3% | -1.7% | -4.9% | -8.9% | -2.2% | 3.6% |
| MSCI China A Momentum Index | 0.6% | 0.3% | 6.5% | 0.0% | 1.4% | 4.6% | -7.0% | -1.6% | -3.1% |
| MSCI China A Enhanced Value Index | 0.5% | -0.3% | 3.9% | -0.2% | -0.9% | 2.7% | 3.2% | 3.9% | 1.0% |
| MSCI China A Mid Cap Equal Weighted Index | 0.7% | -0.6% | 4.5% | -3.3% | -0.7% | 2.5% | -4.8% | -1.1% | -5.7% |
| MSCI China A Growth Target Index | 0.7% | -0.2% | 4.4% | 0.5% | 1.1% | 8.3% | -3.9% | 2.0% | 0.2% |
| Index Name | 1D | 1W | 1M | 3M | YTD | 1Y | 3Y | 5Y | 10Y |
|---|---|---|---|---|---|---|---|---|---|
| MSCI Brazil Index | -0.3% | -0.3% | 12.1% | 7.1% | 24.6% | -3.2% | 3.7% | 12.2% | 3.8% |
| MSCI Brazil Minimum Volatility (USD) Index | 0.1% | -0.1% | 9.5% | 8.5% | 22.7% | 0.6% | 4.9% | 12.7% | 2.7% |
| MSCI Brazil High Dividend Yield Index | 0.7% | 2.2% | 9.0% | 8.1% | 25.5% | 4.6% | -56.8% | -34.1% | -24.2% |
| MSCI Brazil Quality Index | -0.3% | -0.1% | 9.8% | 9.0% | 25.1% | -5.2% | 0.3% | 8.6% | 0.4% |
| MSCI Brazil Momentum Index | -0.3% | 0.5% | 12.0% | 9.9% | 27.5% | 3.7% | 8.8% | 13.8% | 6.4% |
| MSCI Brazil Enhanced Value Index | 0.5% | -1.6% | 9.9% | 8.0% | 25.1% | 0.7% | 5.7% | 17.9% | 5.6% |
| MSCI Brazil Equal Weighted Index | 0.2% | 0.5% | 11.6% | 12.3% | 29.1% | -5.4% | -0.2% | 6.5% | 2.5% |
| Index Name | 1D | 1W | 1M | 3M | YTD | 1Y | 3Y | 5Y | 10Y |
|---|---|---|---|---|---|---|---|---|---|
| MSCI EM Latin America Index | 0.0% | 0.6% | 12.2% | 9.9% | 26.1% | -3.0% | 6.1% | 13.9% | 3.3% |
| MSCI EM Latin America Minimum Volatility (USD) Index | 0.4% | 0.7% | 9.3% | 11.0% | 25.8% | 1.5% | 9.9% | 14.2% | 3.5% |
| MSCI EM Latin America High Dividend Yield Index | 0.2% | 2.0% | 12.8% | 10.6% | 29.8% | 3.4% | 4.9% | 14.8% | 3.1% |
| MSCI EM Latin America Quality Index | 0.1% | 0.9% | 11.3% | 12.6% | 26.7% | -4.5% | 3.2% | 9.8% | 1.2% |
| MSCI EM Latin America Momentum Index | 0.2% | 0.8% | 11.6% | 12.7% | 28.9% | 5.0% | 8.6% | 13.2% | 3.7% |
| MSCI EM Latin America Enhanced Value Index | 0.4% | -1.3% | 10.1% | 9.5% | 27.8% | 4.8% | 9.9% | 20.8% | 6.8% |
| MSCI EM Latin America Equal Weighted Index | 0.3% | 0.8% | 11.4% | 13.2% | 29.6% | -1.5% | 6.7% | 11.6% | 3.1% |
Disclaimer
- All returns over 1 year are annualized.
- The information contained herein (the “Information”) may not be reproduced or redisseminated in whole or in part without prior written permission from MSCI. The Information may not be used to verify or correct other data, to create any derivative works, to create indexes, risk models, or analytics, or in connection with issuing, offering, sponsoring, managing or marketing any securities, portfolios, financial products or other investment vehicles. Historical data and analysis should not be taken as an indication or guarantee of any future performance, analysis, forecast or prediction. None of the Information or MSCI index or other product or service constitutes an offer to buy or sell, or a promotion or recommendation of, any security, financial instrument or product or trading strategy. Further, none of the Information or any MSCI index is intended to constitute investment advice or a recommendation to make (or refrain from making) any kind of investment decision and may not be relied on as such. The Information is provided “as is” and the user of the Information assumes the entire risk of any use it may make or permit to be made of the Information. NONE OF MSCI INC. OR ANY OF ITS SUBSIDIARIES OR ITS OR THEIR DIRECT OR INDIRECT SUPPLIERS OR ANY THIRD PARTY INVOLVED IN MAKING OR COMPILING THE INFORMATION (EACH, AN “INFORMATION PROVIDER”) MAKES ANY WARRANTIES OR REPRESENTATIONS AND, TO THE MAXIMUM EXTENT PERMITTED BY LAW, EACH INFORMATION PROVIDER HEREBY EXPRESSLY DISCLAIMS ALL IMPLIEDWARRANTIES, INCLUDING WARRANTIES OF MERCHANTABILITY AND FITNESS FOR A PARTICULAR PURPOSE. WITHOUT LIMITING ANY OF THE FOREGOING AND TO THE MAXIMUM EXTENT PERMITTED BY LAW, IN NO EVENT SHALL ANY OF THE INFORMATION PROVIDERS HAVE ANY LIABILITY REGARDING ANY OF THE INFORMATION FOR ANY DIRECT, INDIRECT, SPECIAL, PUNITIVE, CONSEQUENTIAL (INCLUDING LOST PROFITS) OR ANY OTHER DAMAGES EVEN IF NOTIFIED OF THE POSSIBILITY OF SUCH DAMAGES. The foregoing shall not exclude or limit any liability that may not by applicable law be excluded or limited.
spaces
Key indicators of factor performance
Key indicators of factor performance
Factors have outperformed in the long run compared to the wider market. However, factors have historically been cyclical to broad and changing market conditions, such as macro environment, valuations, recent performance trends and risk sentiment.
We study the performance of factors in various economic regimes and present it across these key pillars.
Horizontal ruler
Exposures from MSCI’s adaptive multi-factor allocation model
Exposures from MSCI’s adaptive multi-factor allocation model
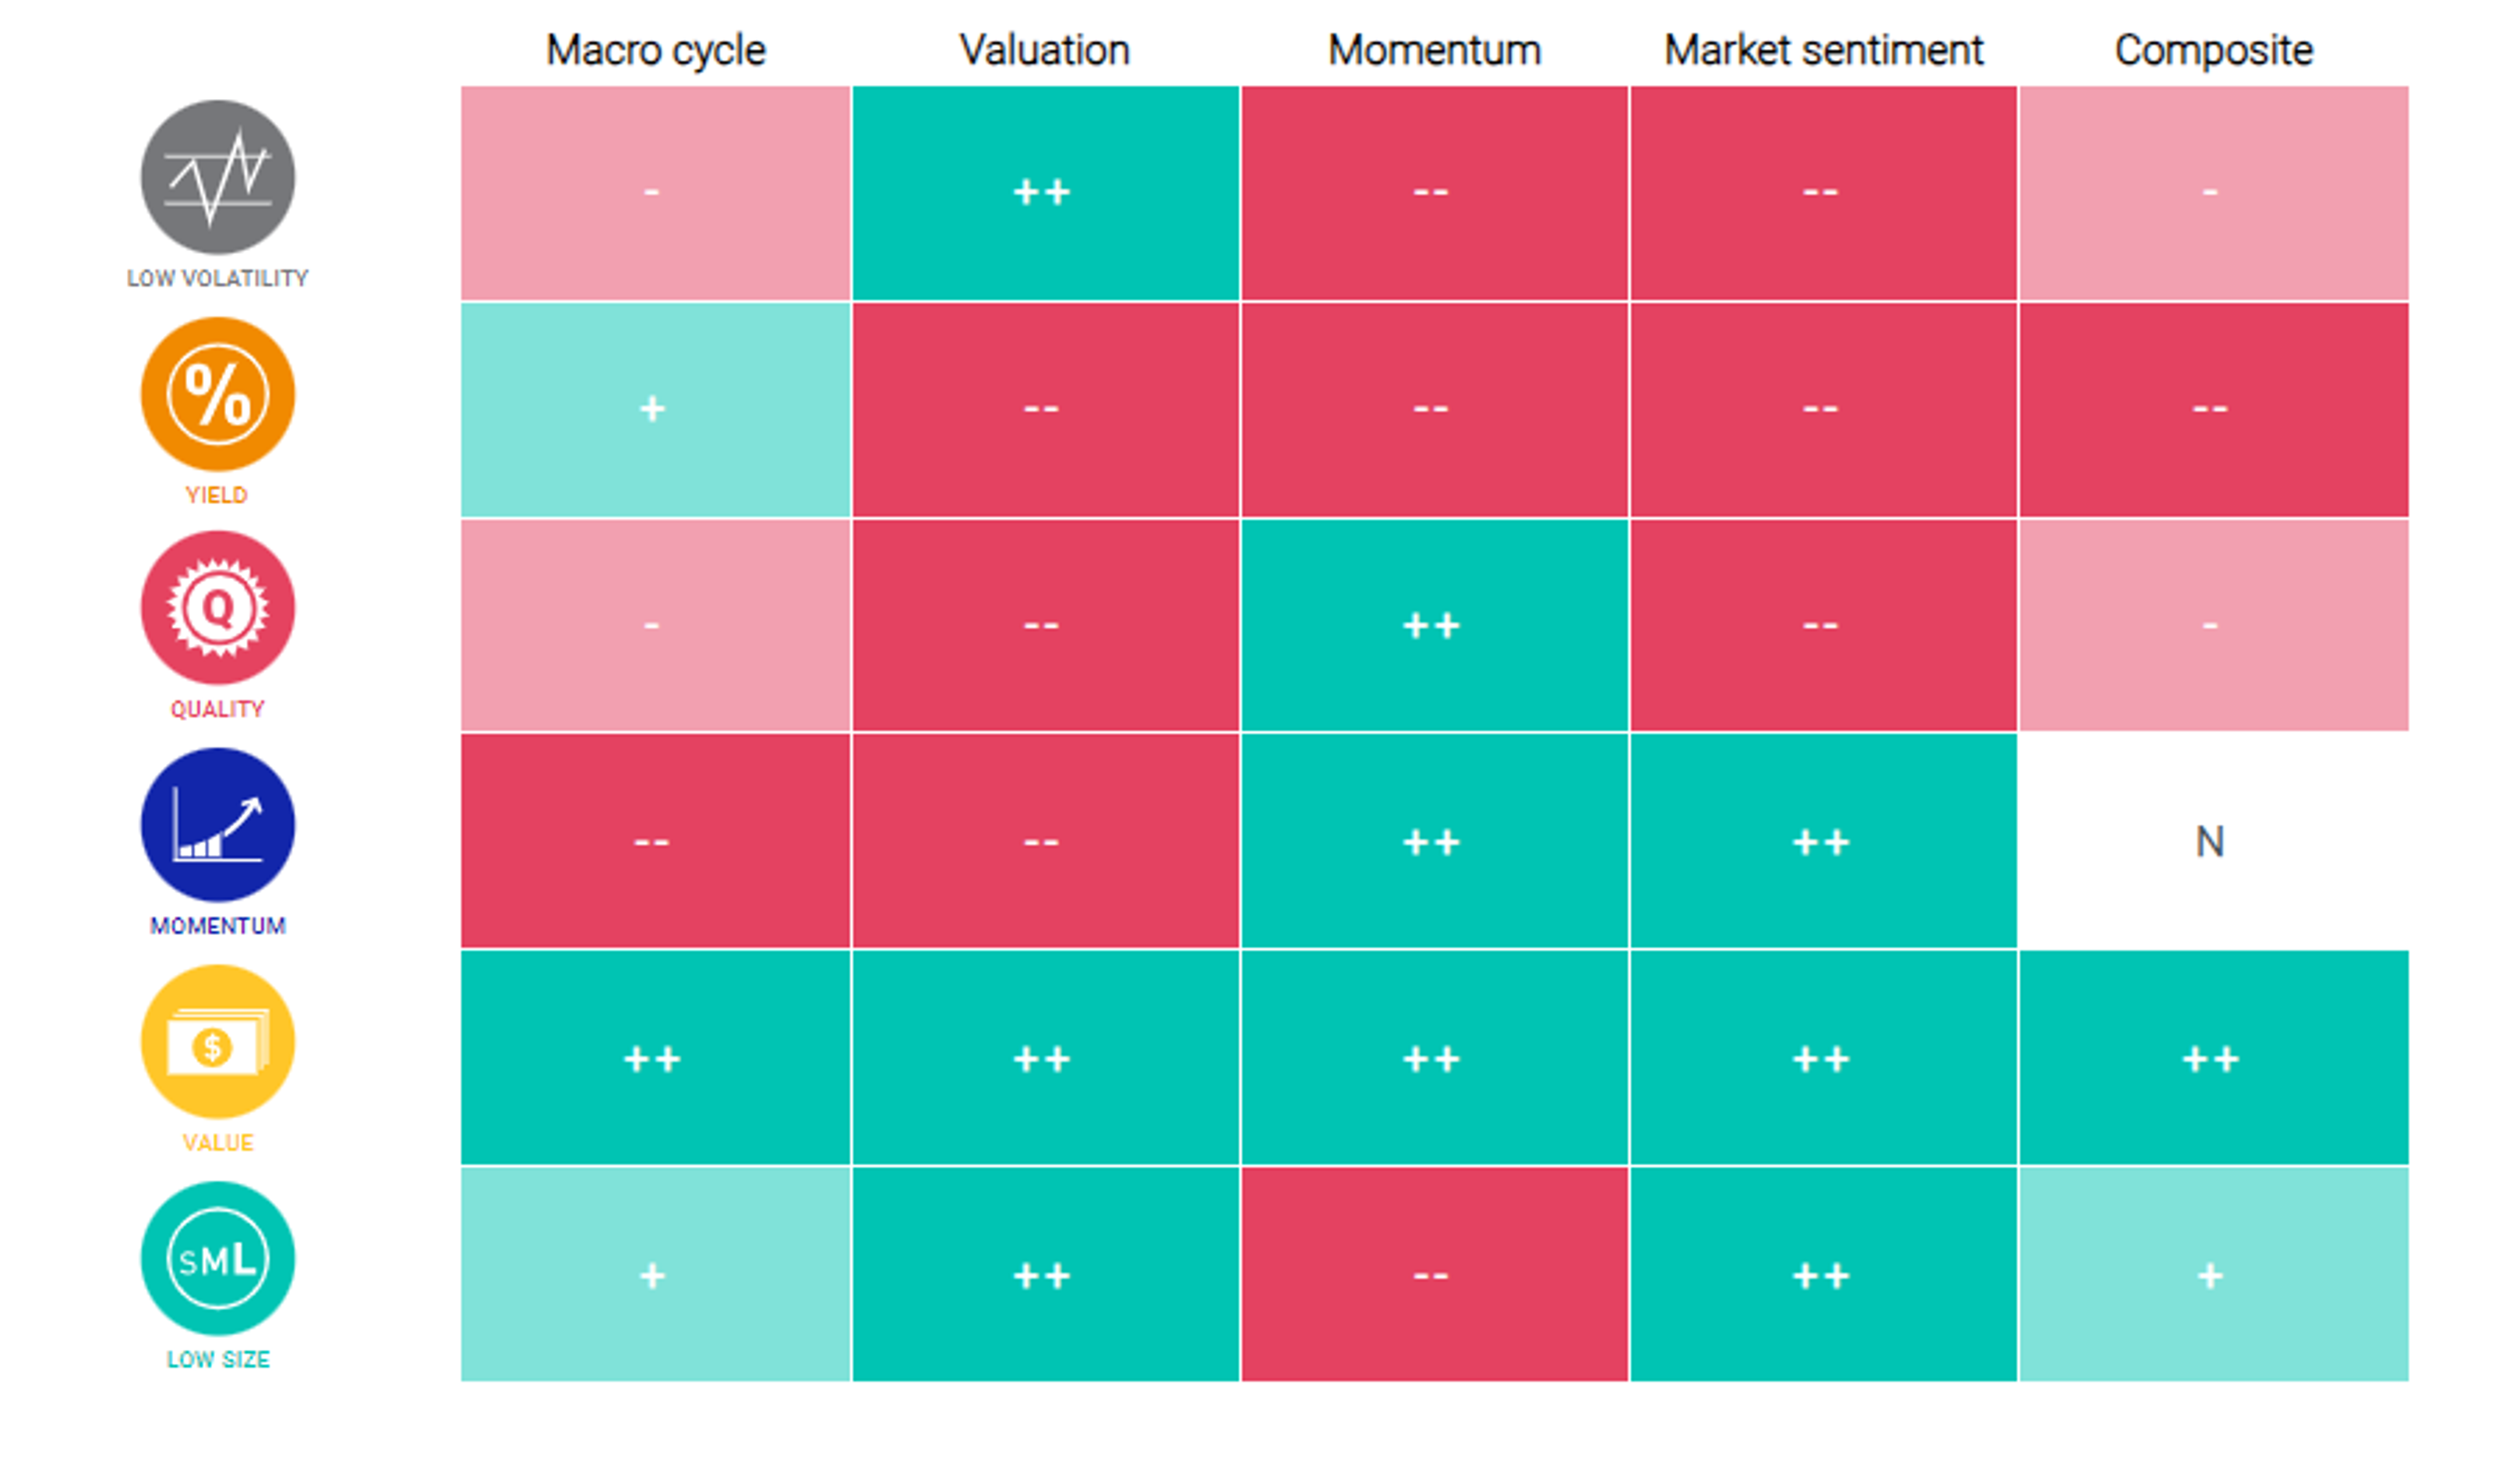
As of March, 2024. Positive exposures are denoted as + or ++, negative as - or -- and neutral as N.
Key highlights
- Our adaptive multi-factor framework is a model designed to analyze factor-based decisions. Our research suggests the value in taking a holistic approach to factor assessment. This approach encompasses the macroeconomic environment, as discussed above, as well as factor valuations, recent performance trends and risk sentiment.
Read the latest Markets in Focus
Featured content
spaces
Markets in Focus
Markets in Focus
Factor returns have been highly cyclical during certain market environments, and their performance varies in different macro regimes. In our Markets in Focus quarterly series, we highlight and analyze the most recent quarterly factor performance.
Horizontal ruler
Factors in focus - 2022 review
Quality outperformed in most regions, value in EM and Asia
Among MSCI’s style-factor indexes, quality delivered positive active returns across all regions except Europe. Quality’s strong showing suggests investors rewarded companies that had stable earnings, low leverage and high profitability in the environment of higher rates. Thematic indexes classified as transformative technologies outperformed the MSCI ACWI Index by a wide margin. Outside of this category, thematic indexes had a challenging year, with the sole exception being smart cities.