Insights gallery archive
Insights Gallery Archive
Powered by MSCI Data Science
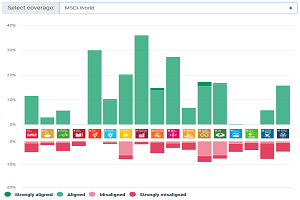
How Well Have Companies Aligned with the UN SDGs?
Use the chart to see global companies’ progress toward the UN Sustainable Development Goals.
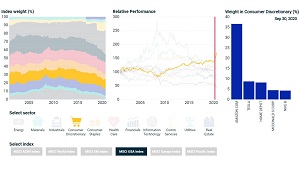
Sector Performance and Concentration
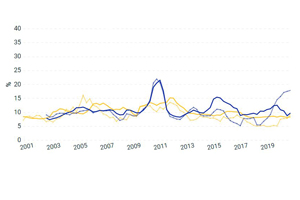
How has sector concentration in equities changed over the past two decades? Interact with our plot.
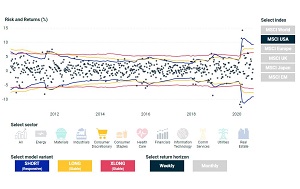
Adaptive Risk Management
Use our interactive plot to compare risk-model alternatives over various risk horizons and observe models’ long-term performance.
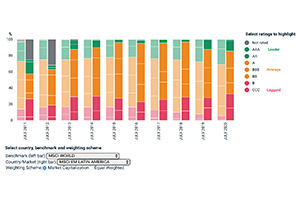
10 Years of ESG Performance: Latin America vs. Rest of World
Use our interactive plot to compare MSCI ESG Ratings by country and market.
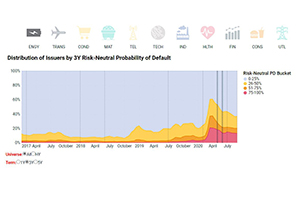
Probabilities of Default in the Corporate-Bond Market
Interact with our chart to see the probabilities of default implied in corporate-bond prices.
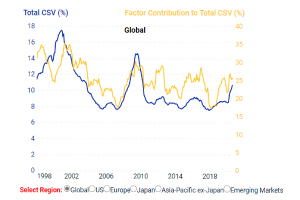
The Dispersion of Stock Returns
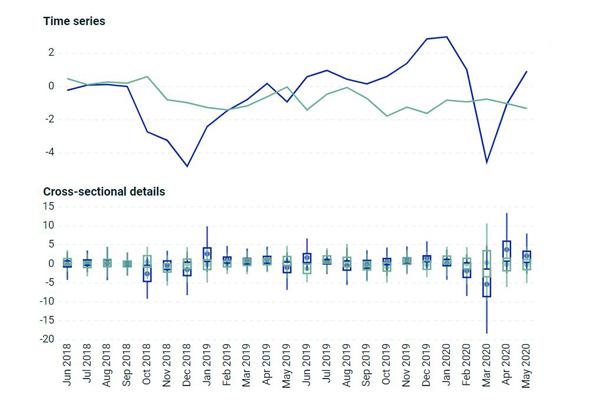
Interact with our chart to see dispersion of equity returns as measured by cross-sectional volatility.
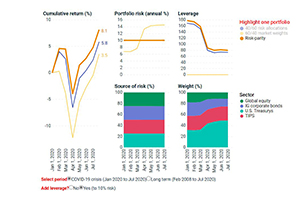
Leveraging Fixed Income During the COVID Crisis
Click through to our plot to see how bond-market leverage and risk allocation between sectors may have impacted the performance of multi-asset-class portfolios.
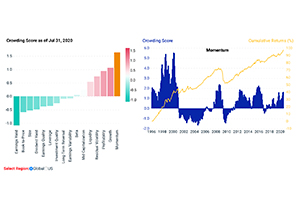
Which Factors May Be Crowded?
Click through to our chart to see the latest factor-crowding scores and how have they changed over time.
Large Stocks Took the Lion’s Share
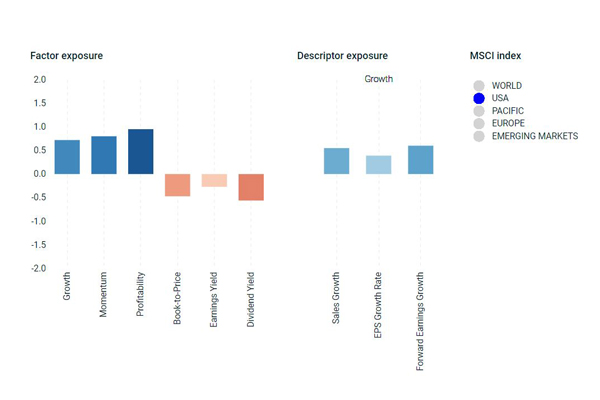
Use our chart to see how the largest stocks have separated themselves from smaller stocks — as measured by factor exposures.
Real Estate Returns’ Dispersion amid COVID
View our interactive chart showing the dispersion of real estate returns, by sector and country, before and during the coronavirus pandemic.
The Rise of Emerging Markets and Asia
Use our interactive plot to visualize the growth of emerging markets and Asia.
Hedge-Fund Performance
Click through to see how hedge-fund strategies have performed amid the COVID-19 pandemic.
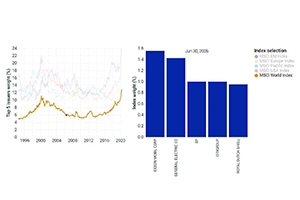
Rise of Market Concentration
View our interactive chart showing indexes’ concentration in their top five components.
COVID-19’s Impact Across Asset Classes
Use our interactive plots to see how selected factor correlations and volatilities of the MSCI Multi-Asset Class Factor Models changed in recent months.
Evolution of Emerging Markets
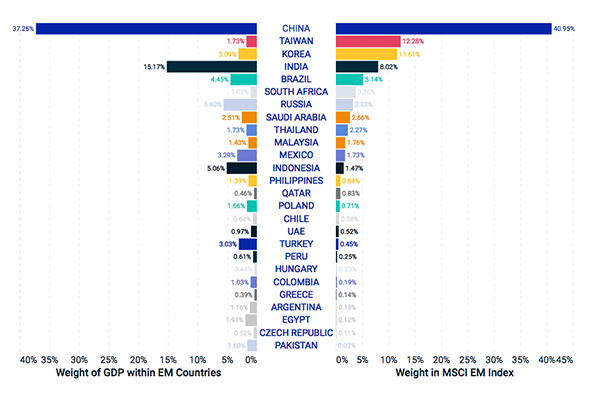
Use our interactive chart to see how emerging markets’ share within global equities has changed over the past two decades.
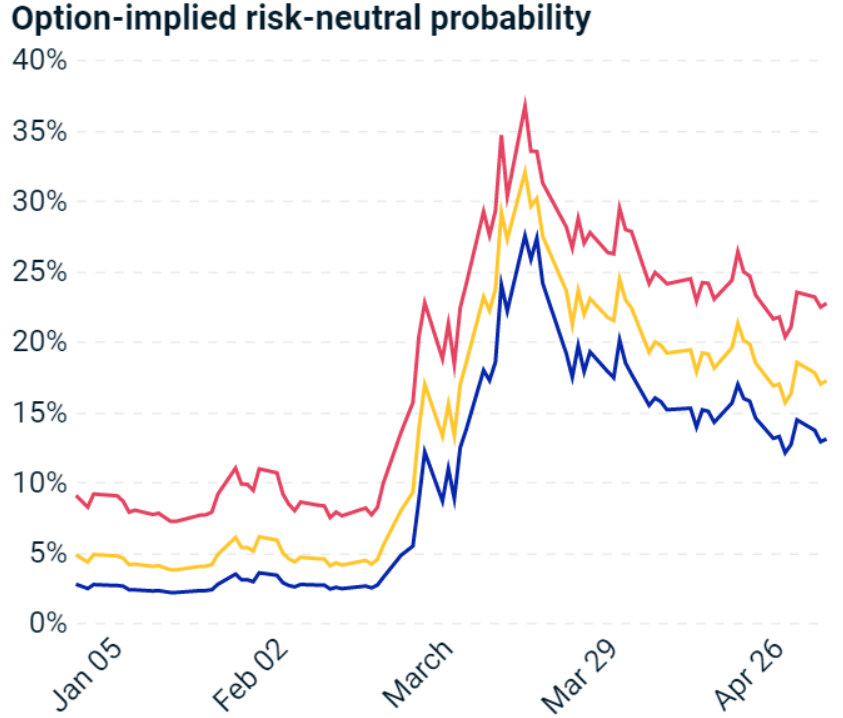
What Option Prices Say About Equity-Market Risk
Click through to view how implied probabilities of further drawdowns have changed recently.
COVID-19 and Drivers of Equity Returns
Click through to view how recent changes in equity-market volatility and correlations compare versus other periods of time.
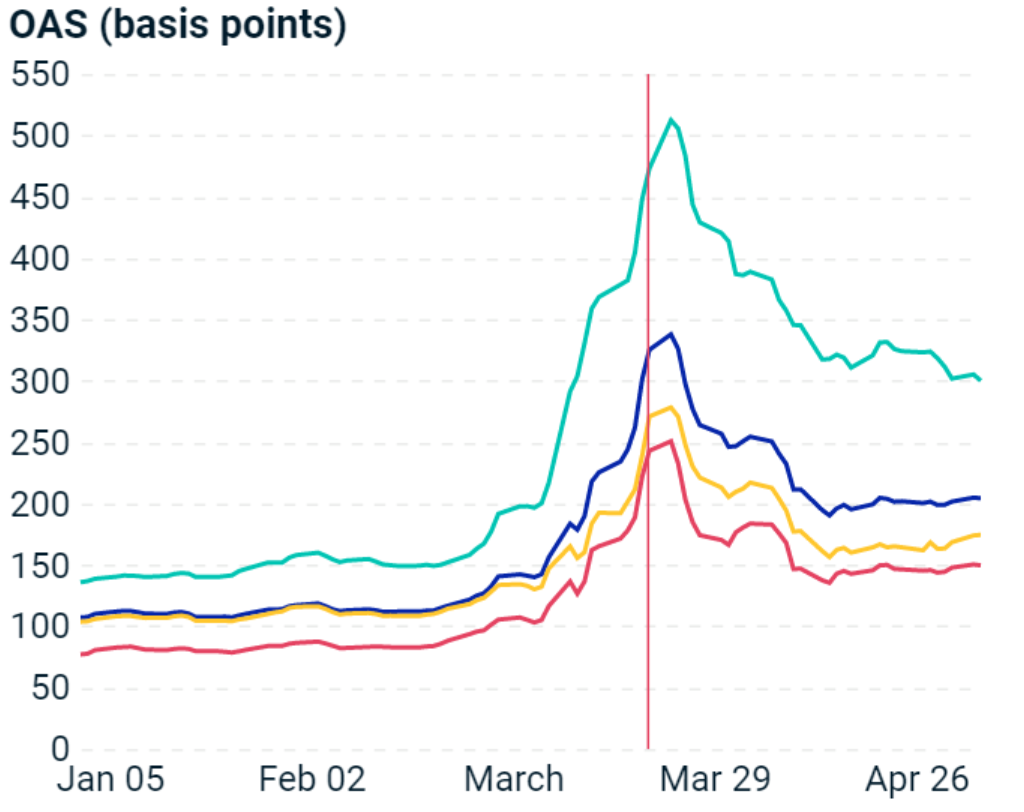
The Effect of the US Government’s Intervention in the Corporate-Bond Market
Click on the chart to explore changes in investment grade spreads by sectors and ratings.
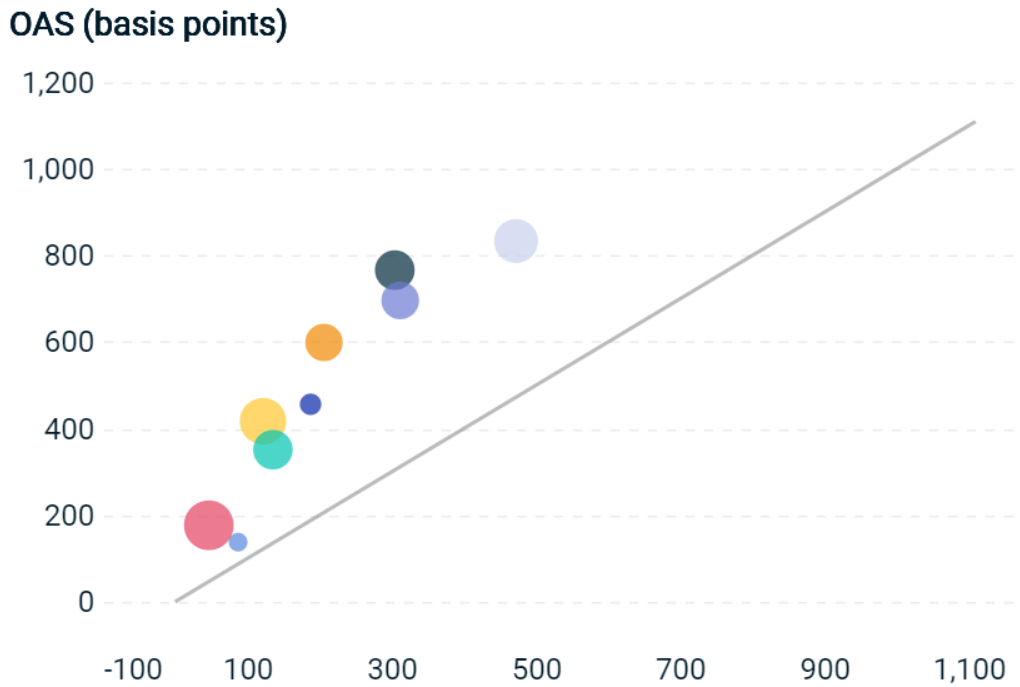
Credit-Spread Behavior Throughout the Crisis
Use our interactive plots to see the behavior of credit spreads throughout the crisis.

