ACWI IMI's Complete Geographic Breakdown Banner
ACWI IMI's Complete Geographic Breakdown
Social Sharing
ACWI IMI's Complete Geographic Breakdown intro
Approximately USD 16.9 trillion in assets are benchmarked to MSCI Indexes*, but how does the index breakdown by country and region, and how has that changed over time?
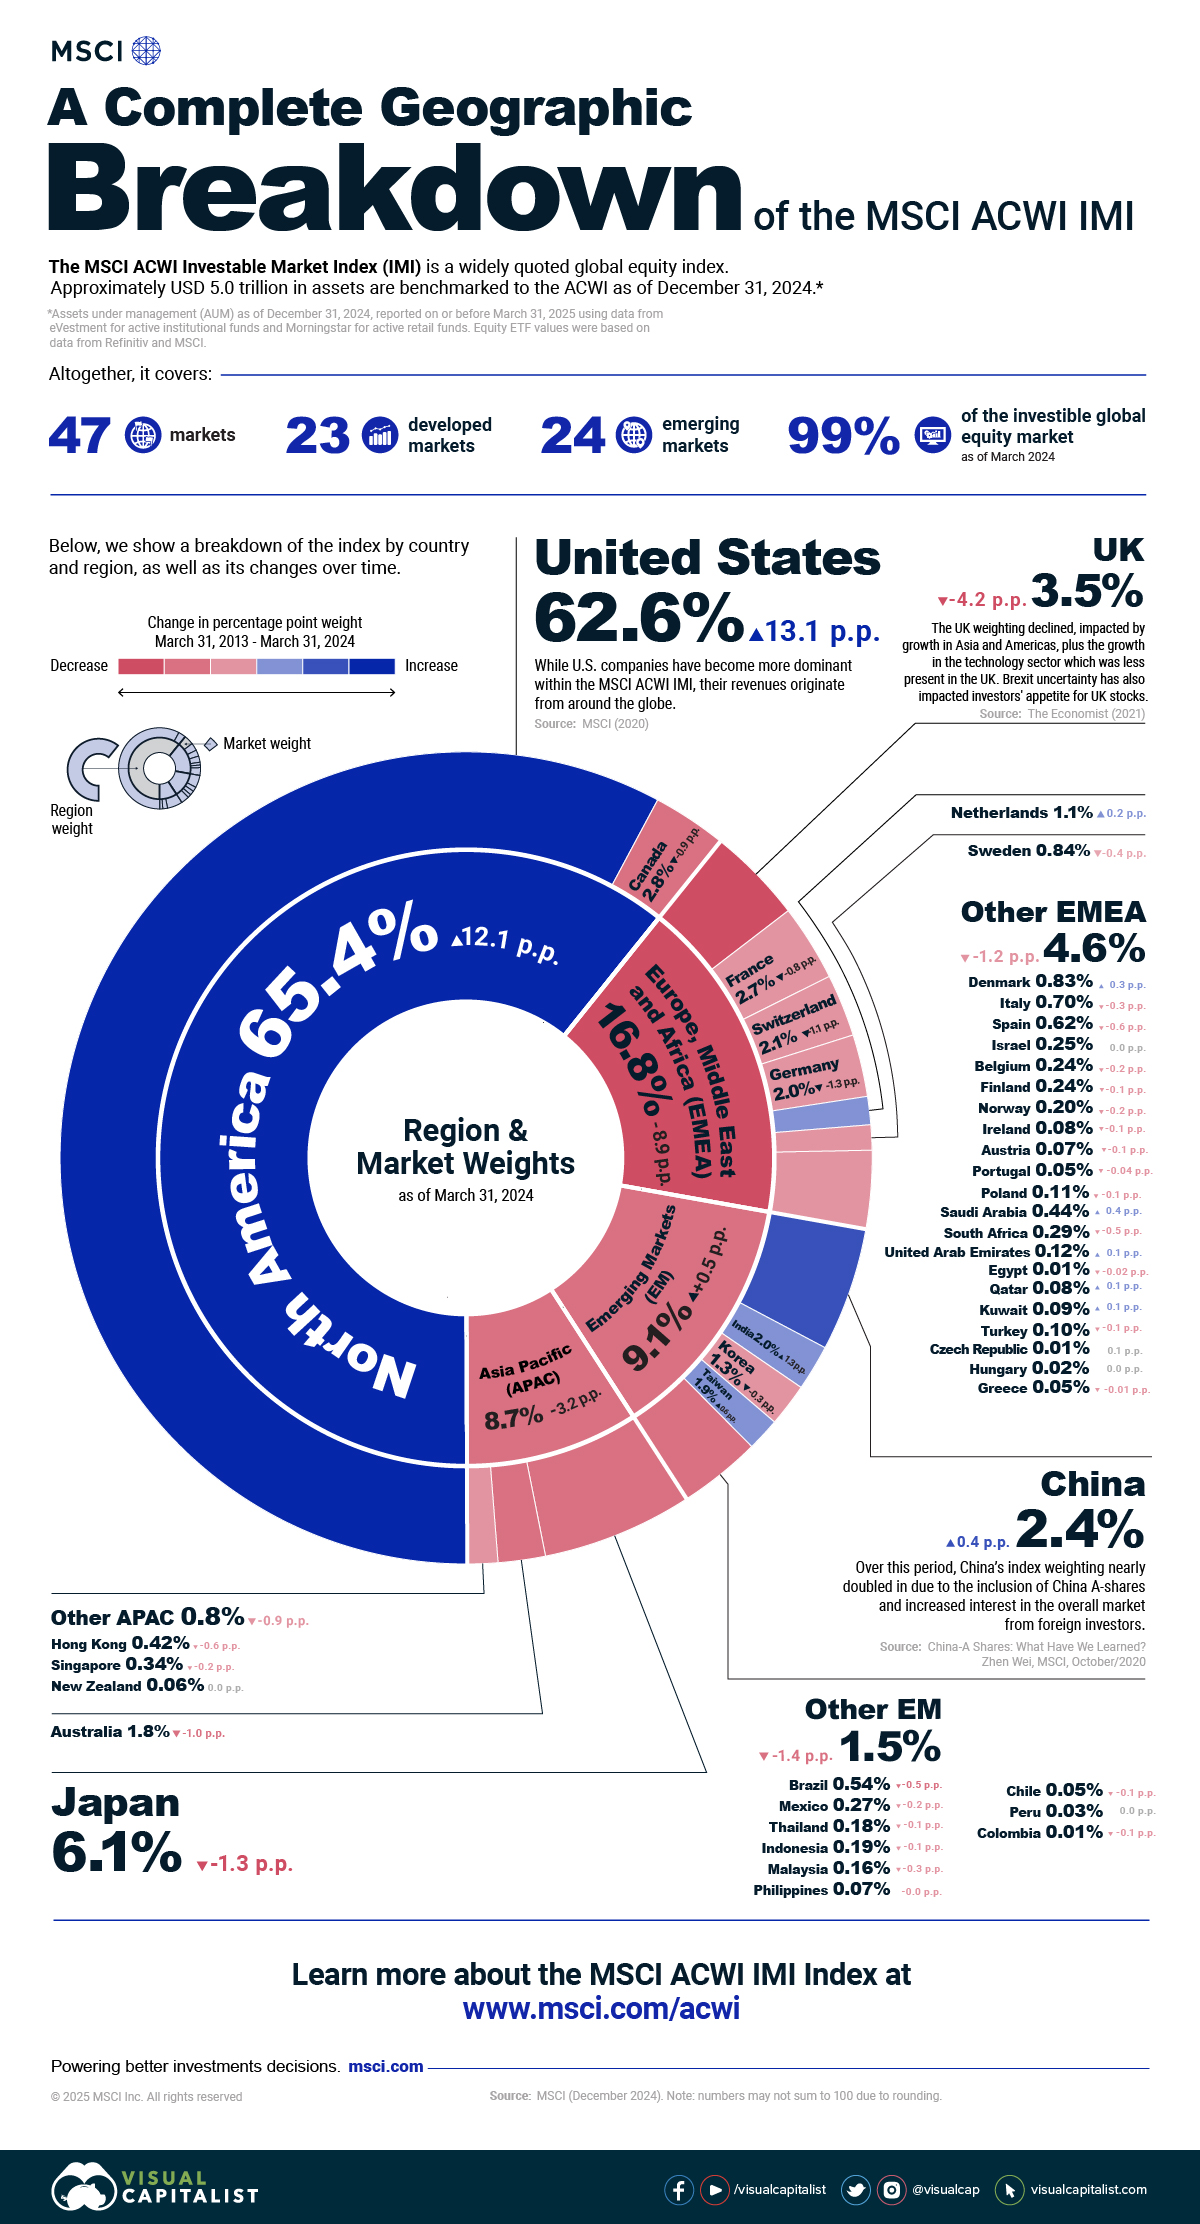
*as of December 31, 2024
Download Infographic Contact Us
ACWI IMI's Complete Geographic Breakdown related content
Related Content
Visualizing Investment Data
We explore and explain topics covering ESG, Climate, thematic, and global investing through visually impactful infographics.
Explore MoreMarket Cap Indexes
Our suite of large, mid and small cap indexes is designed to accurately represent and measure global equity markets as they evolve, meeting a wide range of changing investor needs within a single framework.
Read More