Seven Lean Years and Other Lessons from the Last Tech-Stock Correction title
Seven Lean Years and Other Lessons from the Last Tech-Stock Correction
Social Sharing
Seven Lean Years and Other Lessons from the Last Tech-Stock Correction intro
Anil Rao, Raman Subramanian and Hitendra Varsani
May 23, 2022
The ongoing correction in equity markets has, so far, left few safe harbors for investors. Shares of technology firms have been particularly whiplashed by the sudden reversal of fortune. From Adobe to Zoom — and all the letters in between — many stocks have fallen precipitously from recent highs.
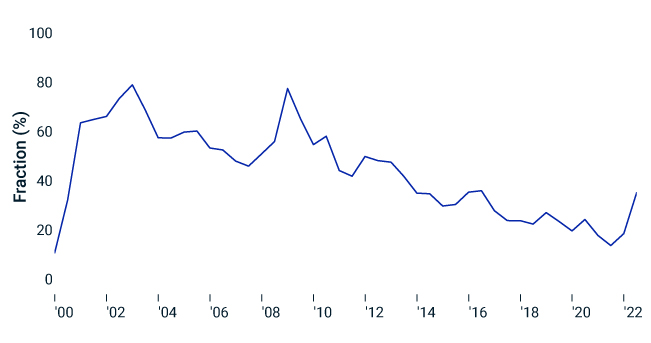
While the share of U.S. technology firms with a substantial drawdown has risen fast, it is not yet at the level of the early-2000s technology crash. It is, nonetheless, worth examining what lessons we might pull from the wreckage of that time.
Lesson one: Recovery was long for the few that survived
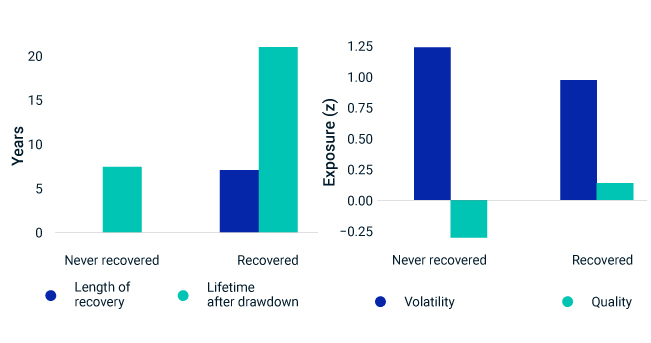
Few firms managed to fully recover from their large losses. Of those that lost half their value between 2000 to 2003, less than 20% ever surpassed their pre-crash highs again and took an average of seven years to do so. Importantly, most of these firms survive as listed entities today.
The rest of the far-fallen firms were not so fortunate. In addition to continuing to shed value, most were acquired, went bankrupt or were delisted from indexes in the ensuing decade.
Lesson two: Recovering firms had common characteristics
The firms that did recover tended to be more defensive — i.e., displaying larger size, higher quality and lower risk — in the immediate aftermath of the crash. This provides hints for today’s investors as to what types of firms have proven more resilient when previous shaky markets found their footing.
While there’s no telling whether history will repeat itself, these lessons could prove useful as investors navigate through another volatile period for tech.
Share of technology firms with significant drawdown has risen

Share of firms in the MSCI USA IMI Technology Index in a 50% drawdown from their previous high.
Firms that recovered after 2003 crash did so in about seven years — and tended to be more defensive

Right plot shows the average exposure for firms throughout 2003 using MSCI FaCSTM .
Seven Lean Years and Other Lessons from the Last Tech-Stock Correction related content
Related Content
Quality in Times of Crisis
High-quality firms historically outperformed in both the growth and value segments of the market. This was consistent across the U.S., international and emerging markets.
Read MoreMarket Uncertainty Has Favored Low-Volatility Indexes
The global market rally that began in April 2020 came to a halt with a sell-off that started at the end of last year and increased in intensity this February with the invasion of Ukraine — leading to a maximum drawdown of 13.6% for the MSCI USA Index.
Explore MoreEvaluating Options in Different Macro and Volatility Regimes
We evaluate the historical performance of systematic options-overlay strategies on equities: “buy-write,” “put-write” (with Treasurys) and “put-protection” strategies, in various macro and volatility regimes.
Learn More