Chart 29 Banner content
Does Small Size Mean Less Opportunity in a Low-Carbon World?
Social Sharing
Chart 29 Intro copy
Abhishek Gupta/ Ashish Lodh/ Ana Harris
Sept 22, 2021
Small caps are usually thought of as having a greater carbon footprint relative to their larger counterparts. Carbon emissions normalized by company revenues, known as weighted average carbon intensity, is a popular indicator to assess a company’s carbon footprint. This metric covers the three emissions scopes identified by the Greenhouse Gas (GHG) Protocol:
- Scope 1: Emissions released into the atmosphere as a direct result of a company’s activities.
- Scope 2: Emissions released into the atmosphere as an indirect result of a company’s activities, including the consumption of purchased electricity, steam, heat and cooling by a company.
- Scope 3: All other indirect emissions that occur in a company’s value chain, including upstream and downstream emissions. Scope 3 are the largest share of most companies’ emissions, but reporting is poor.
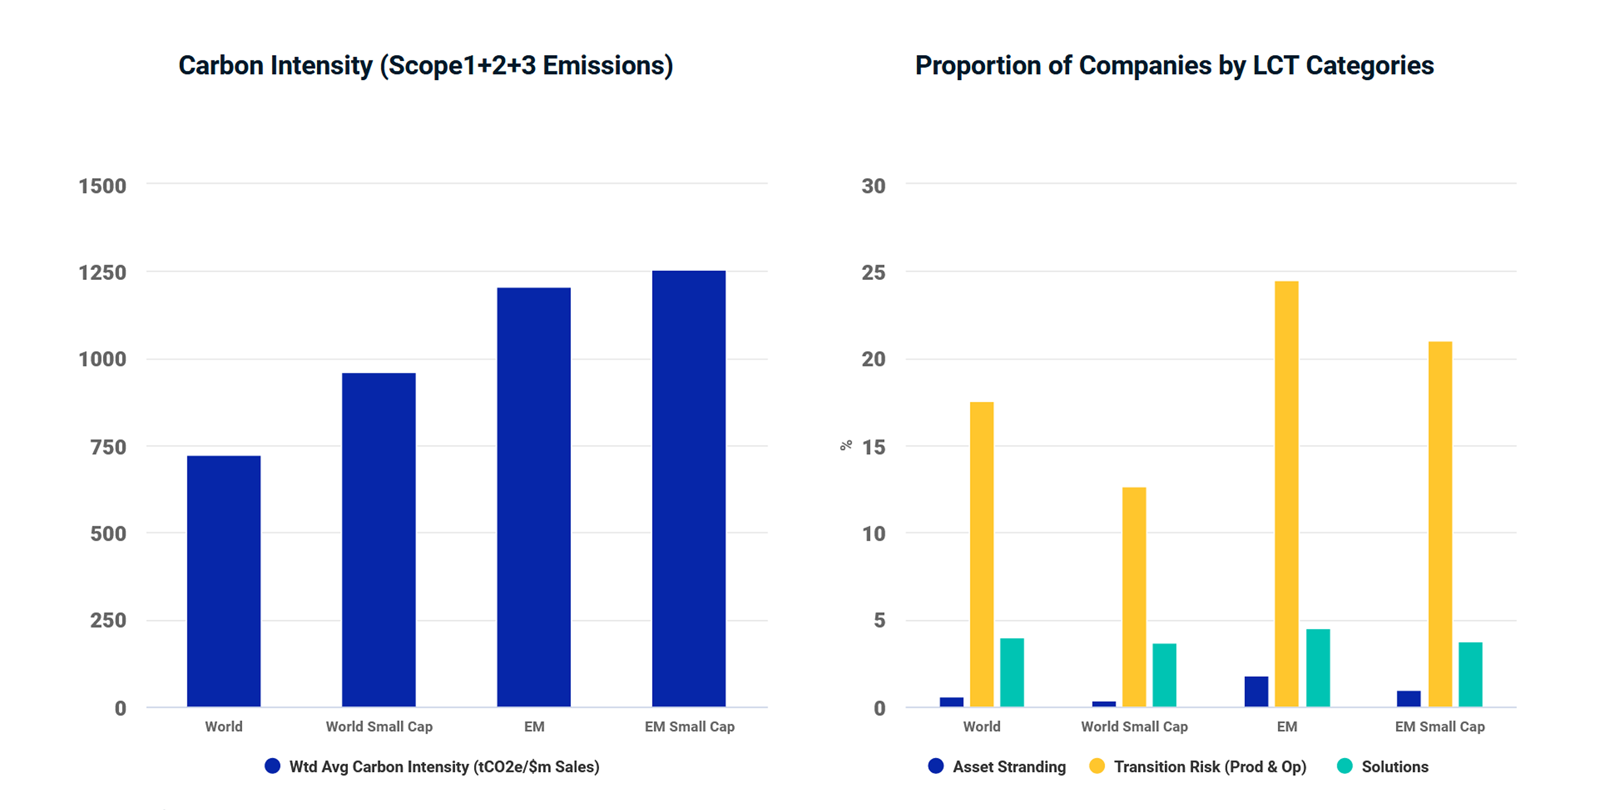
As shown in the chart, the small-cap segment in both developed and emerging markets exhibited higher carbon intensity compared to the standard (large- + mid-cap) segment. Interestingly, the difference in carbon intensity between small and standard indexes was smaller in emerging markets.
Despite the stark picture for the journey ahead of us, the equity investment universe can be analyzed from the point of view not only of climate-transition risks, but of opportunities — and small caps are no exception. Companies can be differentiated based on their ability to capitalize (or not) on opportunities in a low-carbon economy, and those distinctions may provide a road map for building resilient carbon-transition portfolios. The MSCI Low Carbon Transition (LCT) categories provide a holistic assessment of a company’s carbon profile by considering how it manages risks and opportunities arising from climate transition. Both the MSCI Small Cap World and MSCI Small Cap Emerging Markets Indexes included companies that fell in the “Solutions” LCT category, which typically includes clean-technology and renewable-energy businesses that have the potential to benefit from the growth of low-carbon products and services.
Climate Transition Risks and Opportunities

chart 29 Related content
Related Content
Global Investing Trends
You’ll find insights provided in research papers, blogs and a Chart of the Week that succinctly puts topical issues in context.
Explore MoreESG Credentials: How Have Small Caps Stacked Up?
As more investors incorporate ESG considerations into their investment decisions, some companies have changed their behavior, which has led to changes in their ESG profiles.
Explore the ChartAddressing the Lower Liquidity of Smaller Stocks
Investability and tradability, are two vital touchstones of our Global Investable Market Indexes (GIMI) construction methodology.
Read More