Hero - Real Assets Trends 2023
2023 Trends to Watch in Real Assets
Five critical insights to help you navigate challenges ahead
Social Sharing
Video - Real Assets Trends 2023
New perspectives for the road ahead
It can be difficult to make investment decisions about real assets in a period of uncertainty and volatility. We highlight five key trends that are influencing the pricing, performance and trading of assets.
Content - Real Assets Trends 2023
Real estate investors enter 2023 facing a very different investment landscape to the one they encountered at the beginning of 2022. Many property markets were still riding high this time last year. In 2021, they had delivered the strongest returns since before the 2008 global financial crisis (GFC), bouncing back from COVID-19-related weakness on the back of pent-up demand and a particularly buoyant industrial market. As 2022 progressed, however, that pent-up economic demand combined with exogenous supply shocks associated with the Russia-Ukraine war drove inflation to levels not seen in decades.
The future for real estate investing has not been so uncertain since the GFC, and this new environment presents many challenges for investors: Overall deal activity has plummeted as investors pause to reassess the risks they face and underwrite appropriately. While it is clear that sentiment is weak, this pause in activity levels means that pricing evidence is scarce; and for that reason, it will be important to triangulate from a range of data types and sources. Without the tailwind of compressing yields, returns will be driven more by occupier-market fundamentals — which, for office markets, are at a structural turning point. Understanding the interplay of rental growth, occupancy and expenses on delivered income across markets and property types will be key. These factors will be just a selection of the growing number of inputs that may drive asset performance in an increasingly complex investment environment. The ability to attribute risk and performance to a growing number of factors like yield and leasing profile, as well as exposure to more secular risks like climate change, will be increasingly important for investors.
1) Price expectations key for market liquidity
Investors in commercial real estate are focused on the opportunities that will come from a repricing of assets as a period of easy money comes to an end. Some USD 3.2 trillion in assets were sold over the 11 quarters when the 10-year Treasury bond was lower than 2%. Investors in many parts of the world are being forced to reevaluate their rationale for commercial real estate investment in the face of growing costs of capital.
Deal volume is falling globally as investors reassess this investment opportunity. The office market has been particularly hard hit as the changes in the financing of assets is compounded with uncertainty around future demand in key global centers like London and New York.
Sales activity has fallen in these key global centers as potential buyers are unwilling to pay yesterday’s cap rate for an acquisition and will want to underwrite every worst-case scenario for future office demand in any deal. Owners, by contrast, will be fixed on the last comparable sales, sometimes at price levels seen before the pandemic. To drive deal volume back to normal levels, prices would need to decline in both New York and London. Through October 2022, we calculate a 10.4% decline needed for New York offices and a 29.3% change for London, based on historical trends in the supply and demand for real estate investments.
Low transaction activity as buyers and sellers differ on price expectations

Deal volume for all major property types except development sites, for deals of USD 10 million and greater; Q4 2022 data is preliminary; price expectations for office markets only.
2) Multiple lenses on a fast-moving market
It is increasingly clear that commercial real estate is experiencing a downturn but, due to the relative opacity of private real estate, it is not clear how much further we may have to go before we reach the bottom. As transaction activity dries up in the early stages of a downturn, so does the supply of datapoints and comparable evidence for valuations. In such situations it is especially important to look at pricing movements through multiple lenses.
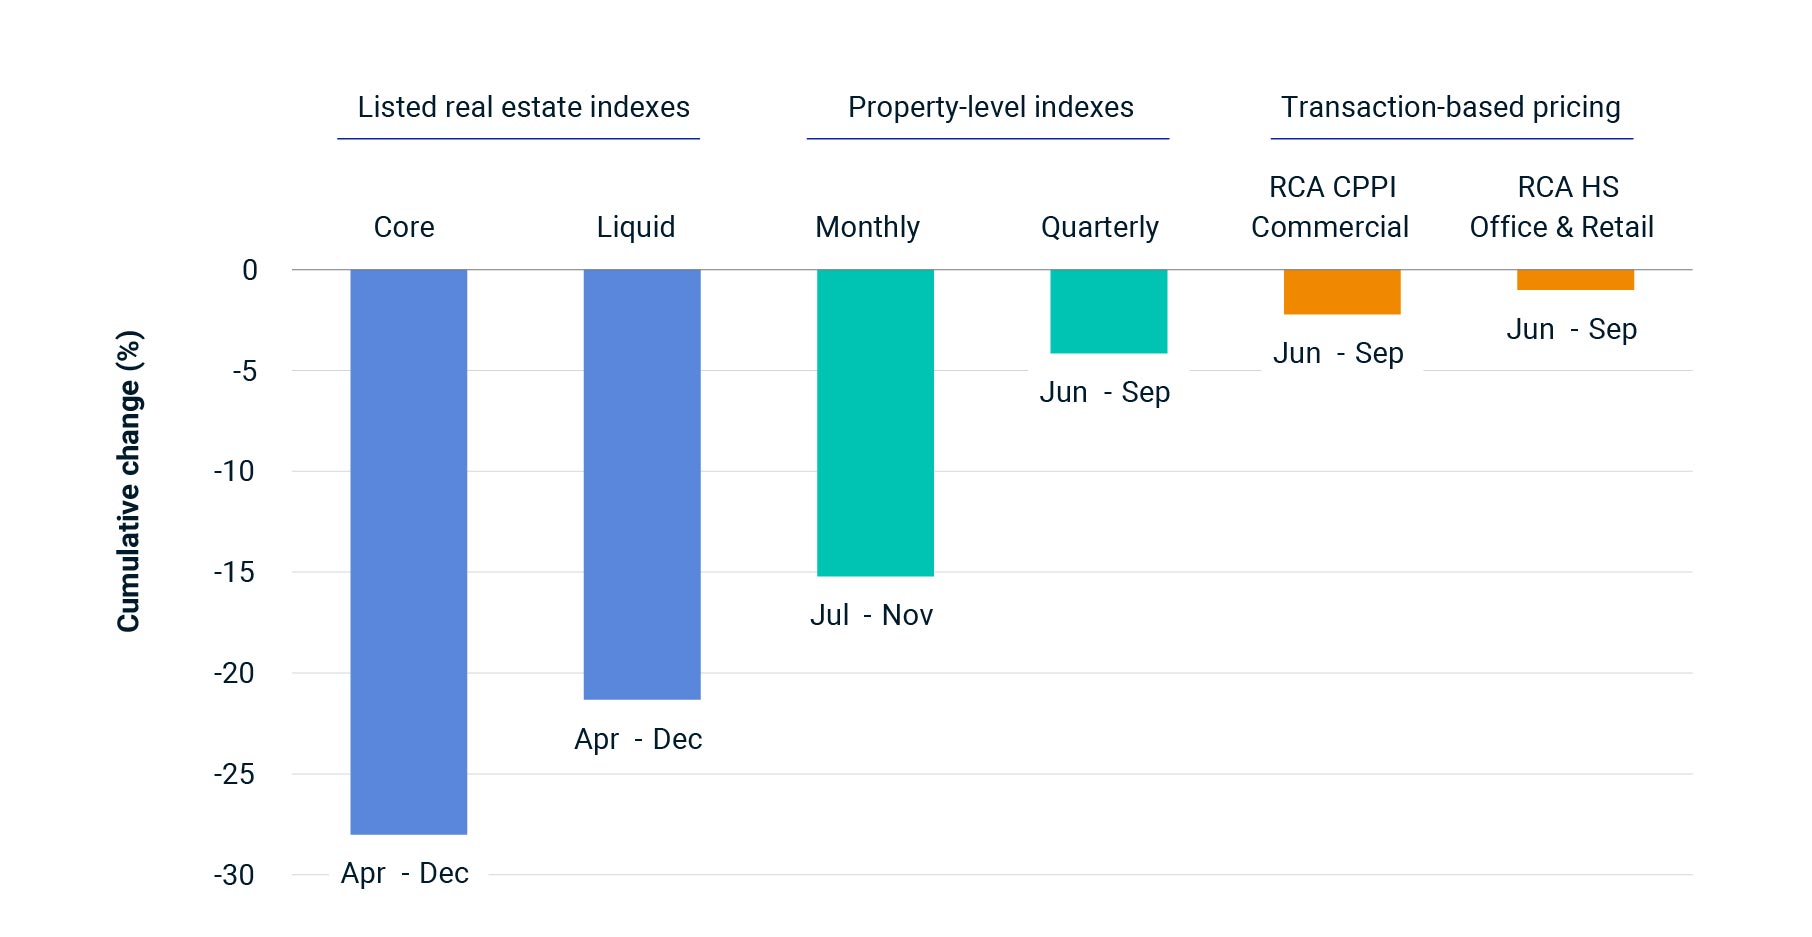
The highest-frequency data with the most sensitivity to changing market conditions comes from daily priced, listed real estate indexes. The MSCI IMI UK Core Listed Real Estate Index currently shows the deepest drawdown from the peak in index levels in April, but the result is clouded by leverage and broader equity-market performance. The MSCI UK Liquid Real Estate Index, which adjusts for company leverage and attempts to strip out some of the equity-market volatility, posted a total return of -22% between April and December 2022.
The MSCI property indexes track performance at the unlevered property level. The frequency and timeliness of these indexes are driven by valuation practices. The U.K. is the only market where such an index is available at a monthly frequency due to the transparency of daily priced, open-end property funds. The MSCI UK Monthly Property Index reflects the performance of the assets held by such funds and shows continued downward pressure on valuations, with November 2022 marking the fifth consecutive month of negative total return for a cumulative decline of -15.2% since the second quarter. The MSCI UK Quarterly Property Index tracks a much broader sample of property but at a quarterly frequency and showed total return of -4% in the third quarter.
Transaction-based indicators painted a somewhat more muted picture, with the RCA CPPI for U.K. commercial down only 2.2% in the third quarter, following a 1.1% decline in the second. Such indicators reflect the movement in actual transaction prices, but in an environment with low deal activity, often only the best properties transact and are reflected in such indexes.
Many measures of a downturn in UK real estate

Data drawn from the MSCI UK IMI Core Real Estate Index, MSCI UK IMI Liquid Real Estate Index, MSCI UK Monthly Property Index (total return), MSCI UK Quarterly Property Index (total return), RCA Commercial Property Price Index and RCA Hedonic Series.
3) Back to the fundamentals: return drivers without yield compression at your back
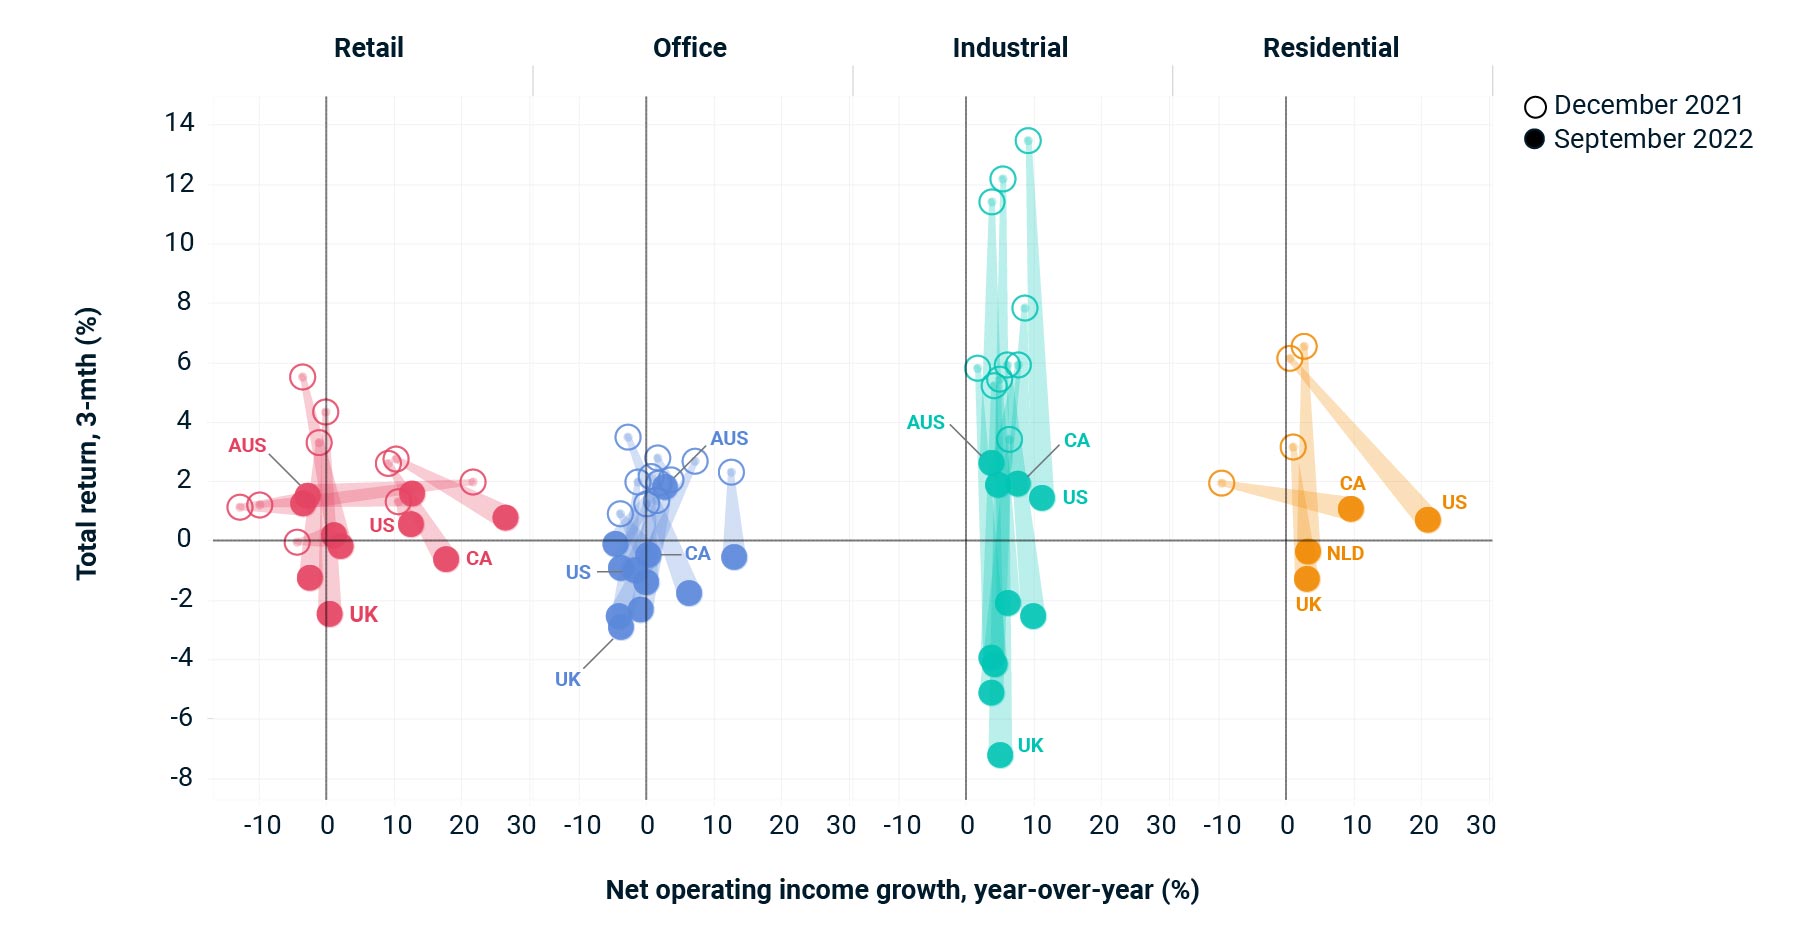
Global real estate returns slowed during the third quarter of 2022, as higher interest rates and inflation coupled with lower economic growth weighed on investment performance. This marked a sharp deterioration since the first quarter, when the MSCI Global Quarterly Property Index recorded its highest annual total return since before the GFC on the back of significant yield compression.
As interest rates increased across a number of major global property markets, property yields in many instances followed suit, which had a negative impact on capital growth across both sector and geography. Industrial property, the top-performing sector since the onset of the COVID-19 pandemic, experienced the largest drop in returns but remained well placed across most major global markets, with lower levels of vacancy and superior growth in net operating income relative to the other core sectors.
The performance trends seen throughout 2022 highlight the extent to which swings in headline returns can become divorced from the fundamentals. Without the benefit of positive yield impact to accelerate returns, managers may need to increase their focus on retaining tenants, managing operating costs and increasing rental income to underpin investment performance. Understanding how these underlying fundamentals impact returns across slices of the market will be key.
Movements in total returns and fundamentals have diverged

Data drawn from The Property Council of Australia/MSCI Australia Annual Property Index, MSCI/REALPAC Canada Quarterly Property Index, MSCI/SCSI Ireland Quarterly Property Index, MSCI Netherlands Quarterly Property Index, MSCI UK Quarterly Property Index, MSCI U.S. Quarterly Property Index and MSCI Europe Quarterly Property Index.
4) Finding resilience in a down market
In previous research we used U.K. data to show how style factors could help real estate investors better understand and communicate the performance of their investments. Two of the factors we looked at in that blog post — yield and leasing quality — exhibited cyclical return performance that might help investors ascertain how their portfolios are positioned for a possible down market.
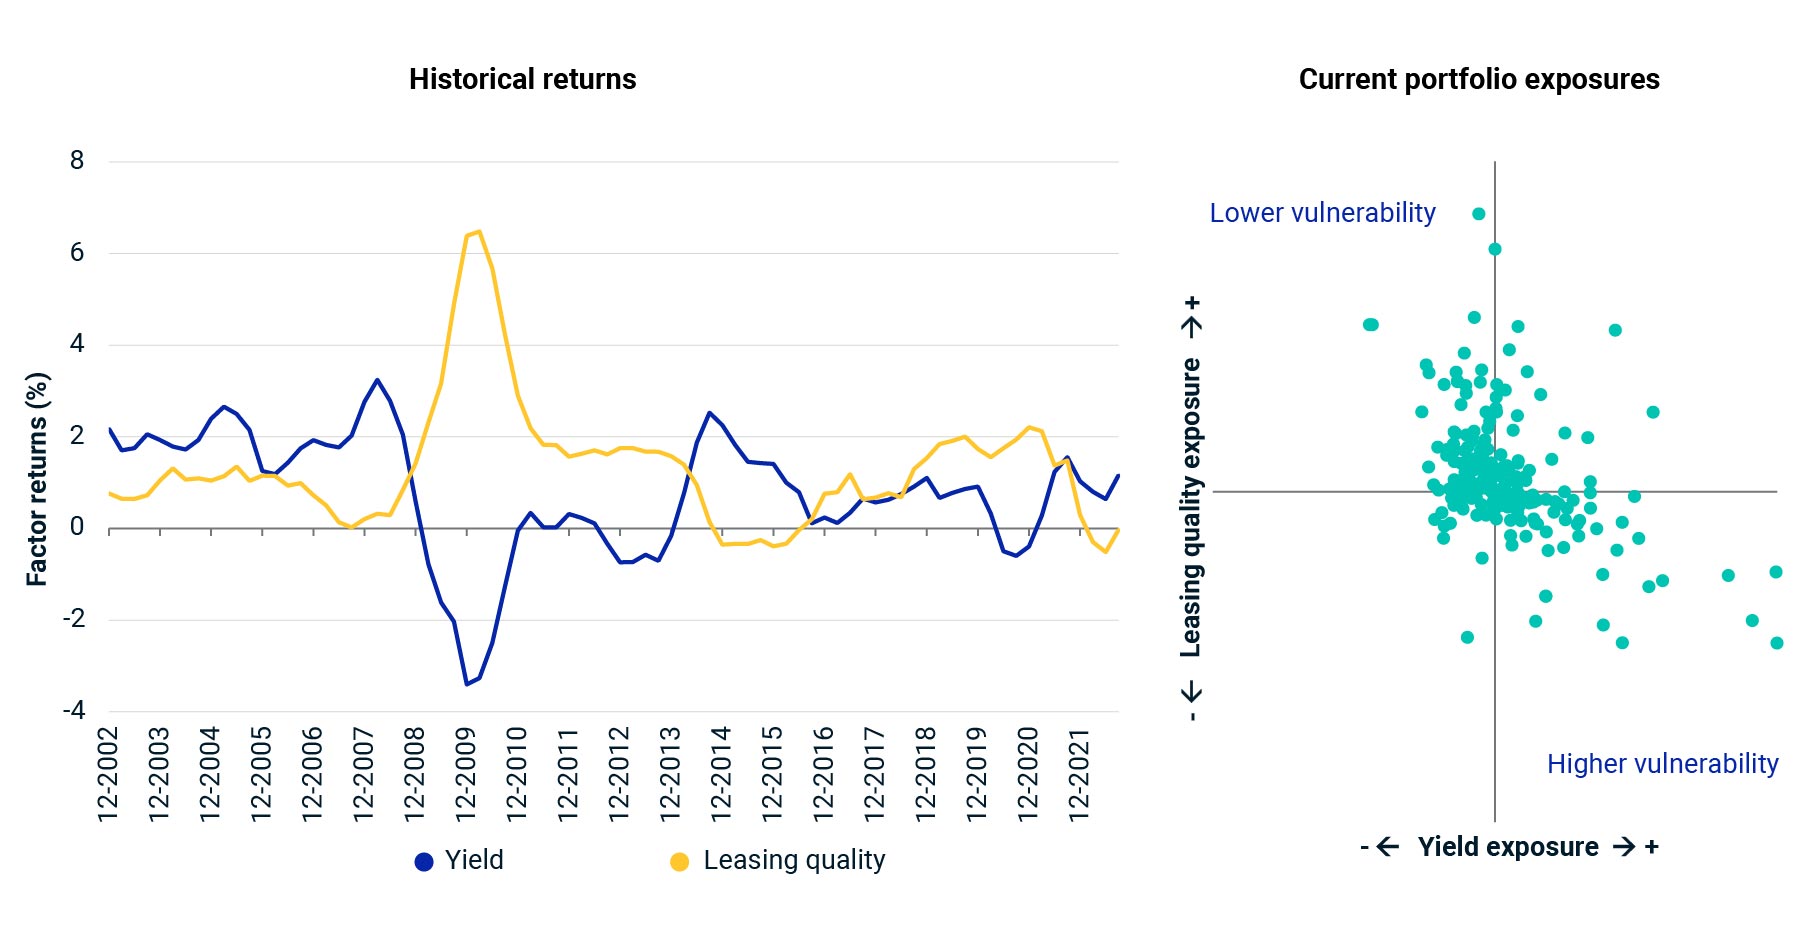
The chart below shows the historical returns of the yield and leasing quality in the MSCI UK Quarterly Property Index. For the yield factor, returns have tended to increase during risk-on phases but turn negative during risk-off periods. Leasing quality, a factor that looks at occupancy rates and remaining lease term, has tended to see stronger returns during weaker growth periods when investors have sought income security over income-growth potential.
Amid concerns that real estate markets may be facing a difficult period in 2023, the exposure of portfolios to these factors may tell us something about their potential resilience. The chart on the right shows the exposure of portfolios in the MSCI UK Quarterly Property Index to these two factors, as at the end of September 2022. Portfolios with higher exposure to leasing quality and lower exposure to yield (those in the top-left quadrant) may be less vulnerable than those with high yield and low leasing quality exposure (those in the bottom-right quadrant).
UK portfolios vary considerably in their factor exposures

MSCI UK Quarterly Property Index; current portfolio exposures for September 2022.
5) Climate risk: abstract concept to financial reality
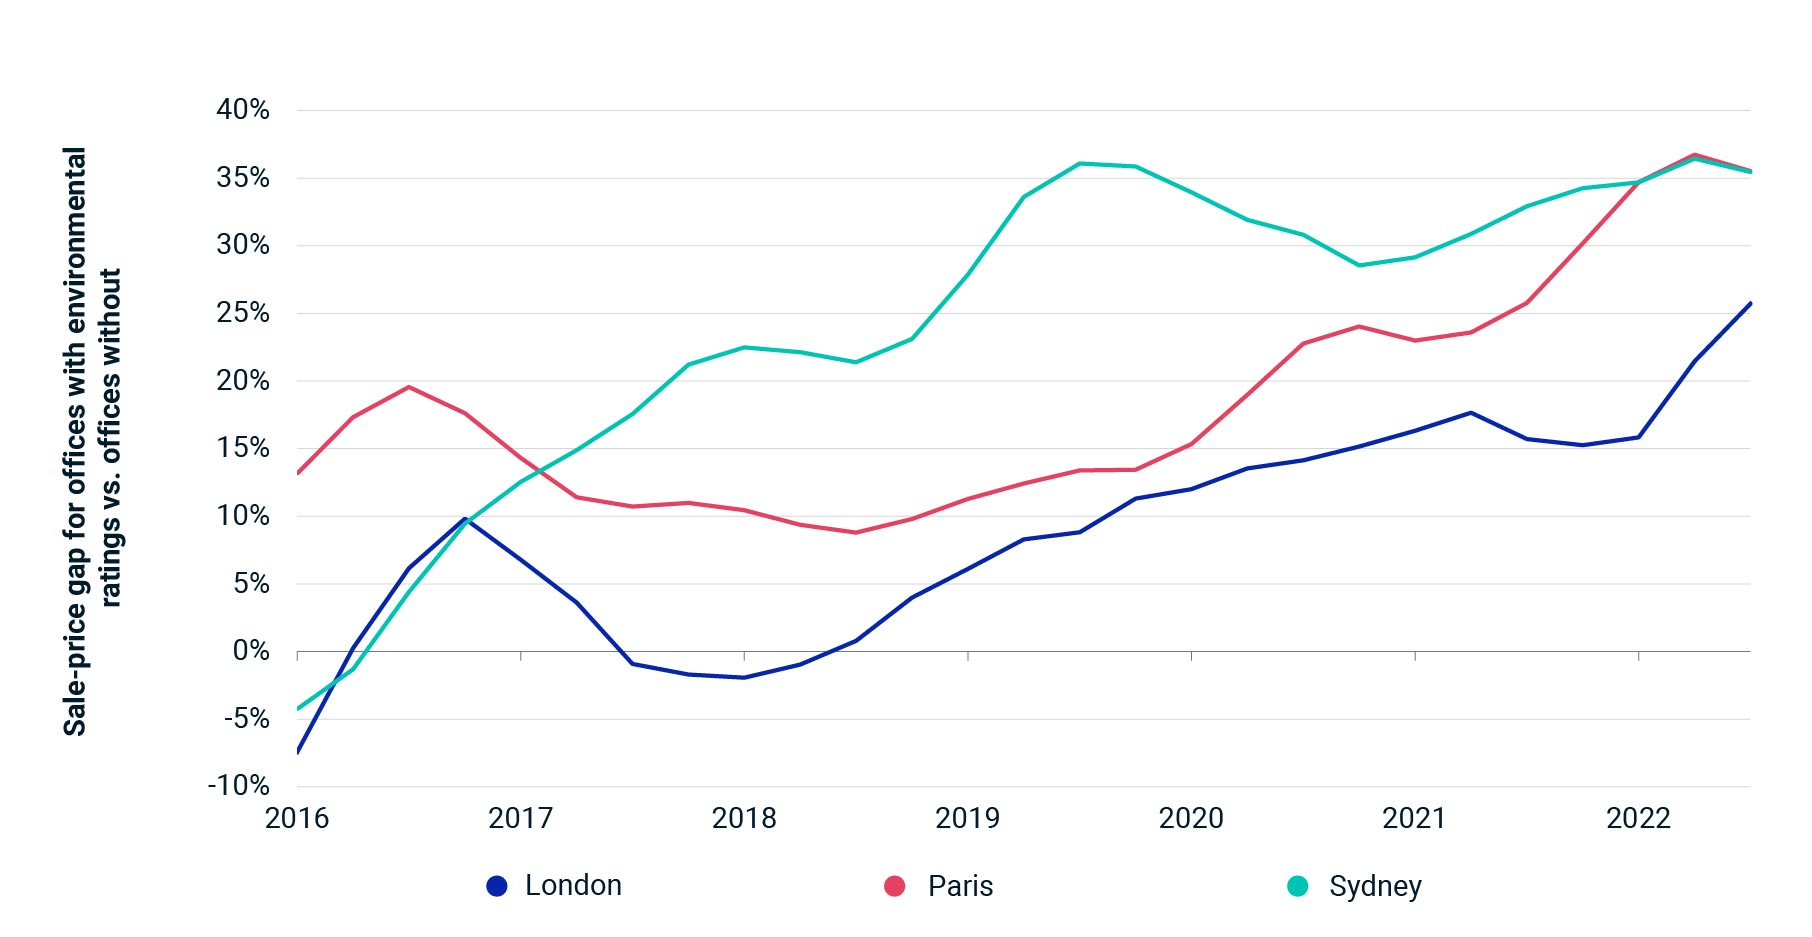
It has proven difficult for investors to price climate risk into their decision-making, with myriad other factors to consider when trading assets. Our study of prices paid for offices in London, Paris and Sydney, however, shows a premium has emerged for buildings that have sustainability ratings from organizations like the Building Research Establishment (BREEAM), GBC Alliance (HQE) and National Australian Built Environment Rating System (NABERS), versus those that have not yet achieved these standards.
While a sale-price premium related to environmental ratings has become evident in the transaction market, MSCI’s work on assets in the Netherlands and Norway does not yet show that actual building emissions have a definitive impact on performance. Reducing a building’s emissions is how the industry will eventually effect real positive change; therefore, the greater risk to a building’s value implied by high emissions should start to be accounted for during the valuation process because of the transition risk.
The threat of write-downs to a property’s value will encourage owners to make the necessary changes to a building in order reduce its emissions intensity. It also means that when these assets come to market, they will do so at a price that accurately reflects the level of capital expenditure required to bring them up to standard, whether these climate-related upgrades are imposed by legislators or through changing market preferences.
The ‘green premium’ for office assets has been growing in some global cities

London sustainability ratings are based on offices that have either BREEAM or LEED ratings; Paris based on BREEAM, LEED, HQE and BBC certifications; Sydney based on offices with NABERS ratings.
The authors thank Jim Costello, Niel Harmse, Tom Leahy, Fritz Louw and Bryan Reid for their contributions to this research.
Research authors - Real Assets Trends 2023
Research Authors
- Will Robson, Executive Director, MSCI Research
- David Green-Morgan, Executive Director, MSCI Research
Related content - Real Assets Trends 2023
Related content
Real assets
As an investment asset class, real assets encompass tangible assets such as real estate and infrastructure.
Learn moreGlobal Real Estate Performance
Track returns of institutional property investments across 27 countries.
Explore more